Automated vs. Manual Wire Harness Assembly | 5 Comparisons
Automated wire harness assembly utilizes machines for tasks like cutting (laser-guided to ±0.5mm) and crimping (with forces up to 2,000 lbs), achieving high-volume output of over 1,000 harnesses daily with minimal error. Manual assembly relies on skilled technicians using hand tools—such as strippers and pneumatic crimpers—for complex, low-volume prototypes requiring meticulous customization and routing that machines cannot easily replicate.
Speed and Volume Comparison
Manual assembly is a meticulous process, with a skilled technician typically taking 3 to 5 minutes to complete a single, moderately complex harness with 15-20 terminations. This human-paced approach is practical for low-volume orders, such as building 50 units for a prototype vehicle or a specialized industrial machine. In contrast, automated machinery operates on a different scale entirely. A single automated wiring system can place up to 2,000 wires per hour, performing terminations, cutting, and stripping at a pace no human team can match. This isn't just about moving faster; it's about achieving the consistent throughput required for large-scale manufacturing, like producing 10,000 harnesses for a consumer appliance line within a tight deadline.
The core of this comparison lies in pure, quantifiable output. Manual assembly is intrinsically limited by human stamina and the 8-hour workday. Even with a team of 10 experienced technicians, maximum output might cap at 200-300 harnesses per shift, assuming each unit takes roughly 15 minutes to assemble. This output is also susceptible to a ~5% natural variance in speed due to fatigue, concentration lapses, or varying complexity between units. Automation removes this biological ceiling. An automated production line operates 20-24 hours per day with minimal downtime, maintaining a constant output rate. The machinery's speed is measured in milliseconds per termination, not seconds, allowing a single machine to output several hundred finished harnesses in a single shift.
A major automotive supplier documented a 400% increase in harness production output after integrating automated assembly lines for a high-volume model, reducing the per-unit assembly time from 8.5 minutes to just under 2 minutes.
This speed directly translates into how projects are scoped and priced. For a manual process, scaling up volume almost always means scaling up labor, incurring significant and linear increases in hourly wage costs, training time, and required floor space. The marginal cost per additional harness remains relatively constant. Automation, however, has a high fixed cost but a very low marginal cost. The initial investment in equipment is substantial, often ranging from 500,000 depending on complexity. However, once operational, the cost to produce each additional harness drops dramatically. The ROI (Return on Investment) is calculated based on volume; the machine becomes exponentially more cost-effective with each unit produced. Therefore, the break-even point is a critical calculation. If your production volume is consistently below 5,000 units annually, the math often still favors manual labor.
For volumes exceeding 20,000 units, automation isn't just an option; it's a necessity for maintaining profit margins and meeting delivery schedules. The throughput capacity of automation is its greatest asset, fundamentally enabling mass production at a feasible cost per unit.
Error and Consistency Rates
Studies of electronics manufacturing show a typical human error rate ranging from 0.5% to 1.5% for repetitive wiring tasks. This means in a batch of 1,000 harnesses, each with 50 connections, you could expect between 250 and 750 total defects. These errors aren't random; they follow patterns, often spiking towards the end of a 4-hour work period or when task complexity increases, like moving from a 10-pin connector to a 40-pin one. This variability introduces significant quality control costs, as 100% inspection is often required for critical applications, adding 15-20% more time and 10 per unit in labor to the final cost.
Automated assembly systems are engineered for repeatability. Their error rates are measured in parts per million (PPM). A well-calibrated machine can achieve an error rate below 50 PPM, which translates to just 5 faulty connections in every 100,000 made. This isn't just about being more accurate; it's about eliminating the statistical variance seen in human performance. The machine applies 22 newtons of crimp force to every terminal, every time, with a tolerance of ±0.5 newtons. It strips wire insulation to a depth of 5.2 mm with a precision of ±0.1 mm. This level of consistency is physically impossible for a human to replicate over an 8-hour shift. The result is a dramatic reduction in process variability, which is the true enemy of quality. This is quantified by process capability indices; where a manual process might achieve a Cpk of 1.0 (just barely capable), automation can consistently achieve a Cpk of 1.67 or higher, indicating a statistically robust process with minimal deviation from specifications.
The financial impact of these error rates is profound. A single field failure due to a wiring fault can cost a manufacturer 500 in warranty labor, shipping, and replacement parts, not including the intangible cost of brand damage. For a batch of 10,000 units with a 1% defect rate, that equates to 100 potential field failures, representing a latent liability of 50,000. Automation virtually eliminates this financial risk. The consistency also reduces material waste. A human operator might misstrip and ruin a wire 3-5 times per 100 operations, wasting costly pre-cut wire. An automated machine reduces this scrap rate to less than 0.1%, generating direct savings on materials like copper and insulation, which can account for 60-70% of the harness's total cost.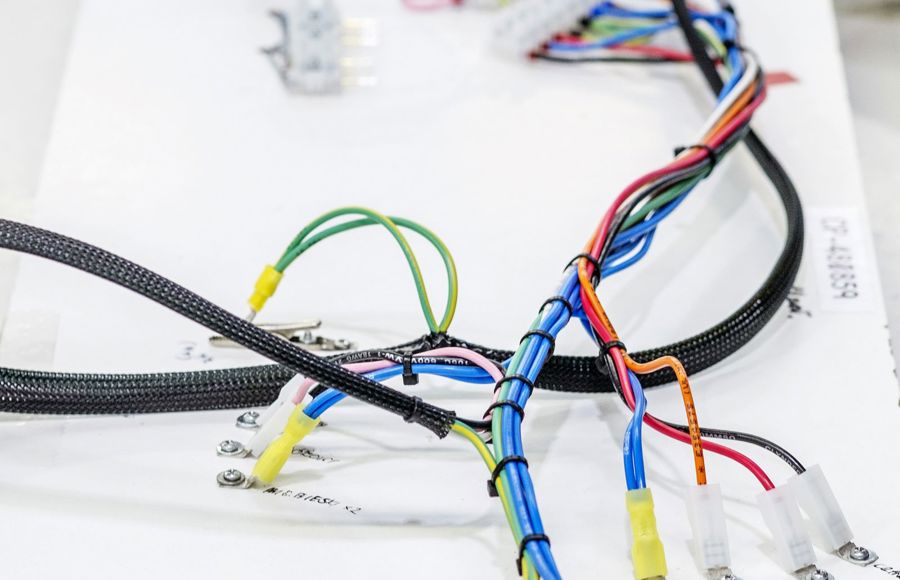
Upfront and Long-Term Costs
A manual assembly station requires a minimal initial investment of 15,000, covering basics like benches, tools, and simple testers. In stark contrast, a semi-automated assembly machine starts at around 300,000 to $ 600,000+. This 15x to 40x difference in initial outlay is the primary barrier to automation for many small and medium-sized enterprises. However, this upfront figure is only a fraction of the total cost story. The real analysis unfolds over a 3 to 5-year period, where operational costs dominate and the high fixed cost of automation is gradually diluted by its significantly lower variable costs.
|
Cost Factor |
Manual Assembly (Per Station/Year) |
Automated Assembly (Per Machine/Year) |
|---|---|---|
|
Initial Investment |
15,000 |
600,000 |
|
Direct Labor Cost |
65,000 |
15,000 |
|
Training & Onboarding |
4,000 |
1,000 |
|
Error & Rework |
10,000 |
500 |
|
Maintenance & Support |
1,500 |
10,000 |
The most impactful financial difference is in direct labor cost. A single manual assembly station requires one operator, costing 65,000 annually in salary, benefits, and overhead. This cost is recurring, subject to 3-5% annual increases, and scales directly with production volume. To double output, you double your labor force. An automated machine may require only 0.2 FTE (Full-Time Equivalent) for oversight, loading, and minor interventions, slashing the annual labor cost to 15,000. This creates an annual labor savings of 50,000 per station replaced. For a manufacturer replacing 10 manual stations, that's $400,000+ in saved labor costs every year.
Beyond labor, other operational expenses diverge sharply. Manual assembly incurs ongoing costs for training new hires (a 4,000 process taking 4-6 weeks to reach full productivity) and high costs for correcting errors, estimated at 10,000 annually per station in scrap and rework labor. Automation flips this model. It has a higher, predictable maintenance contract cost of 10,000 per year for a specialized technician to perform bi-annual calibrations and replace wear parts like cutters and strippers. However, its near-elimination of errors saves 9,500 per station annually.
Handling Complex Designs
A luxury automobile's main body harness can contain over 1,200 individual wires, spanning 1.5 miles in total length, and terminated into 150+ unique connectors. Manual assembly of such a harness requires a team of 5 technicians working for over 8 hours, relying heavily on detailed documentation and intense concentration. The probability of introducing an error during this process is high, often exceeding 5% for a first-time build. This complexity isn't just about quantity; it's about handling 22 to 28 AWG gauge wires alongside shielded coaxial cables for GPS, all within a ±2 mm tolerance for branch-out locations. Automation, however, is fundamentally built to manage this complexity through precision and programmability, transforming a daunting manual task into a repeatable digital process.
The advantages of automation in handling intricate designs are not singular but multi-faceted, impacting the entire production lifecycle:
-
Precision in Confined Spaces: Automated machinery excels at inserting tiny terminals into high-density connectors. A machine can reliably populate a 60-pin micro-connector with pins spaced 0.5 mm apart, applying the exact 45 newtons of insertion force required for each cavity. A human operator would struggle with the visual strain and physical precision needed for this task, often requiring magnification and experiencing a 15% higher misinsertion rate on connectors with more than 40 positions.
-
Integrated Testing and Validation: The true value of automation emerges during in-process testing. A automated system can perform a 100% electrical continuity test as it builds, checking for opens, shorts, and miswires in under 30 seconds per circuit. It can also measure resistance at the milliohm level to identify poor crimps immediately. In a manual process, this testing is a separate, post-assembly stage, often taking 20-25 minutes for a complex harness and requiring a dedicated technician. This creates a significant bottleneck and delays feedback.
-
Rapid Changeover and Programming: While initial programming of an automated machine for a new design takes 40-80 engineering hours, changeovers thereafter are swift. Switching production from one harness variant to another can be achieved in under 15 minutes by loading a new digital program. Manual assembly requires physically relaying workstations, redistracting hundreds of pages of drawings, and retraining operators, a process that can halt production for an entire 8-hour shift and introduce a high risk of errors during the transition.
The economic impact of these capabilities is profound for complex, low-to-medium volume production, such as for aerospace, medical equipment, or specialty vehicles. For a harness with 500+ connections, the manual rework time to locate and fix a single wiring error can exceed 60 minutes. On a complex assembly, this means a single defect can turn a 1,200 loss-maker once diagnostic and correction labor is factored in.
Change and Adjustment Flexibility
A manual assembly process can incorporate a last-minute design tweak—like swapping two wires in a 30-pin connector—in minutes, often with just a verbal instruction to an operator. This agility is ideal for building 50 prototype units or fulfilling a 10-unit custom order where the harness design may change 3-4 times per week. Automation, by contrast, requires formalized change management. A simple wire change necessitates a programmer modifying the digital build file, which can take 30-60 minutes, and then validating the updated program, adding another 20 minutes of machine downtime. This creates a fundamental tension between the structured world of automation and the dynamic needs of low-volume, high-mix production.
The flexibility of each method manifests in several key areas:
-
Engineering Change Orders (ECOs): Implementing an ECO in a manual setting costs little more than the 15 minutes of technician time to understand the change. For automation, an ECO requires 1-2 hours of programmer time at a 120 hourly rate, plus 30-45 minutes of non-productive machine time for validation, totaling an average cost of 350 per change.
-
Low-Volume Production Runs: Manual workstations can be reconfigured for a batch of 5 unique harnesses in under 1 hour. Setting up an automated machine for a short run of 20 units requires 3+ hours of programming and setup, making the cost-per-unit for small batches prohibitively high.
-
Operator-Led Problem Solving: A seasoned technician can visually identify a faulty batch of terminals with a 0.1 mm diameter deviation and adjust their crimping technique accordingly. An automated machine will consistently mis-crimp every terminal in that batch until a human intervenes to recalibrate the applicator.
This isn't to say automation is inflexible; its flexibility is just front-loaded into software. The major advantage emerges when changes need to be deployed across an entire production fleet. Once a design is finalized and perfected in the digital realm, deploying that updated program to 10 identical machines across a global factory network can be done in under 1 hour remotely. This ensures that a critical improvement—like increasing wire strip length from 5.0 mm to 5.3 mm to improve pull-out strength—is implemented instantaneously and identically everywhere. Achieving the same change across 50 manual operators would require scheduling training sessions, issuing revised paper drawings, and enduring a 1-2 week transition period filled with inevitable human error and misinterpretation.
The financial calculus for flexibility is a function of product life cycle stage and order profile. For products in the early R&D phase or for manufacturers specializing in custom-built orders under 100 units, manual assembly's operational flexibility delivers a lower total cost and faster turnaround. The break-even point for automation's rigidity typically occurs when production volumes are high enough to absorb the 1,000 cost of a programming change across thousands of units.
For a high-volume product line making 50,000 units annually, a single engineering change that improves reliability by 0.5% will save 250 field failures, justifying its implementation cost many times over. Therefore, the most adaptable manufacturing strategy often involves a hybrid approach: using manual labor for prototyping and small batches and reserving automated lines for stable, high-volume production, ensuring flexibility and efficiency are both optimized.
In summary, the choice between automated and manual wire harness assembly involves key trade-offs. Automated assembly excels in speed, producing thousands of units per day with minimal errors, making it ideal for high-volume production. However, it requires substantial upfront investment in machinery and lacks flexibility for last-minute design changes. Conversely, manual assembly offers superior flexibility for prototypes and low-volume, complex designs but is slower and can have higher error rates from human fatigue, impacting long-term consistency despite lower initial costs.
