How Do Cable Harness Manufacturers Ensure Quality
Cable harness manufacturers ensure quality through incoming material checks (e.g., wire diameter ±0.05mm via micrometer), in-process continuity/insulation tests (every 500pcs with megohmmeter ≥100MΩ), final AQL 1.5 sampling, and monthly 2hr staff training per IPC/WHMA-A-620 standards.
Designing for Reliability
Data from the automotive sector shows that a recall due to wiring issues can cost a manufacturer an average of $500 per vehicle, not including reputational damage. This is why reliability is engineered into the product from the very first sketch. It’s a proactive process focused on preventing field failures by simulating real-world conditions during the design phase. We use computer-aided design (CAD) software to create a digital twin of the harness, running simulations for electrical load, thermal stress, and mechanical vibration before a single wire is cut. For a typical 12-circuit automotive harness, this simulation can predict over 95% of potential failure points, such as insufficient wire gauge for a 10-amp load or chafing against a sharp bracket.
For a harness operating in an engine bay, we specify wires with cross-linked polyethylene (XLPE) insulation rated for a continuous temperature of 125°C, far beyond the standard 105°C PVC insulation. This small material change, which may add 5-7% to the raw material cost, drastically reduces the probability of insulation brittleness and cracking over the product's target 15-year service life. Connector choice is equally critical. We prioritize connectors with gold-plated pins (0.5-1.0 µm thickness) for low-voltage signal applications because this plating offers stable contact resistance below 50 milliohms, even after 500 mating cycles, preventing intermittent signals.
We maintain a minimum bend radius of 4 times the cable diameter for dynamic applications to prevent conductor fatigue. Wires are grouped by their function and sensitivity; for instance, high-current paths (e.g., 50-amp starter motor lines) are routed away from low-voltage sensor lines (e.g., 5V camshaft position sensors) to minimize electromagnetic interference (EMI). This separation can reduce noise by up to 60% compared to bundled routing. The design process also includes defining precise tensile strength requirements for crimps. A standard crimp for a 16 AWG wire must withstand a pull force of at least 70 Newtons without any movement.
|
Design Consideration |
Standard Practice |
Performance Target |
Impact of Deviation |
|---|---|---|---|
|
Wire Gauge Selection |
18 AWG for a 10A circuit |
< 5% voltage drop over 5 meters |
Overheating, potential fire hazard |
|
Connector Sealing |
IP67-rated seals |
No moisture ingress after 30 min at 1m depth |
Corrosion, short circuits |
|
Crimp Quality |
Pull force test |
> 70 N for 16 AWG |
Intermittent connection, high resistance |
|
Harness Routing |
100mm min. from exhaust |
Surface temp < 100°C |
Insulation melting, failure |
This data-driven approach culminates in a Design Failure Mode and Effects Analysis (DFMEA). This is a living document where a cross-functional team scores potential risks based on severity (1-10), occurrence (1-10), and detection (1-10). A high Risk Priority Number (RPN) triggers a design change. For example, if a wire's path has a high probability (Occurrence: 7) of chafing against a metal edge, which would be a severe failure (Severity: 8), and it's hard to detect in testing (Detection: 7), the RPN of 392 forces a re-route or the addition of a protective convoluted tubing with a wall thickness of 0.8mm.
Testing Every Connection
In automotive manufacturing, electrical issues account for over 30% of all warranty claims, with poor terminations being a primary culprit. To combat this, manufacturers implement a multi-layered testing strategy that scrutinizes every single electrical pathway. This process begins with a 100% continuity test on every harness as it comes off the assembly line. This test, which takes less than 5 seconds per harness, verifies that every intended connection has low resistance (typically < 1 ohm) and, crucially, that there are no accidental shorts (where resistance falls below a 5-ohm threshold) between circuits that should be isolated. This initial screen catches the majority of assembly errors, such as a missed crimp or a pin inserted into the wrong cavity, with a detection rate exceeding 99.5%.
This test applies a high voltage, say 500 V DC for 2 seconds, between current-carrying conductors and the harness shield or ground. The goal is to measure the insulation resistance, which must be greater than 100 MΩ to pass. This verifies that the insulation can withstand voltage spikes without breaking down, a key factor in preventing short circuits and electrical fires. For a harness with 50 circuits, this test adds approximately 15-20 seconds to the cycle time but is indispensable for functional safety certifications like ISO 26262.
For an engine harness, this means sending a 12V, 5-amp pulse to a fuel injector circuit and measuring the voltage drop across the entire path. A drop exceeding 0.5V would indicate excessive resistance, often from an under-crimped terminal. These testers can also simulate CAN bus communication at 500 kBaud, checking for signal integrity and the absence of crosstalk. This level of testing can identify over 80% of potential field failures that simpler tests might miss.
|
Test Type |
Key Parameters |
Pass/Fail Criteria |
Purpose & Value |
|---|---|---|---|
|
Continuity Test |
Resistance Measurement |
Open Circuit: > 100 kΩ |
Catches miswires and basic assembly faults. |
|
Hipot Test |
500 V DC, 2 sec |
Insulation Resistance > 100 MΩ |
Validates dielectric strength and insulation quality. |
|
Functional Test |
Applied load, signal analysis |
Voltage drop < 0.5V, clean signals |
Simulates real operation to find performance flaws. |
For a factory producing 10,000 harnesses daily, this generates millions of data points. We track metrics like First Pass Yield (FPY), which for a complex harness should be above 98.5%. A dip to 96% triggers an immediate investigation into the root cause, which is often traced back to a specific machine or operator station. This data-driven feedback loop allows for corrective actions within 30 minutes of a problem appearing, minimizing scrap and rework. The cost of this rigorous testing is factored into the unit price, typically adding 5 to the cost of a harness, but it prevents recalls that can cost hundreds of times that amount per unit.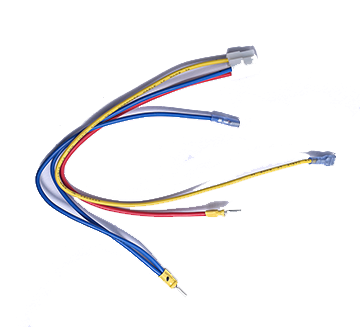
Inspecting Materials Used
A 15% reduction in the cross-sectional area of a copper strand due to impurities can increase electrical resistance by over 20%, leading to dangerous heat buildup. This is why leading manufacturers don't just order parts to a specification; they enforce that specification through a rigorous inbound inspection protocol. This process treats every batch of incoming materials as guilty until proven innocent, employing a combination of destructive and non-destructive tests on a statistically significant sample size. For a shipment of 10,000 meters of wire, a 30-meter sample is taken from three different reels for testing.
We use a laser micrometer to verify the diameter of individual copper strands, which must be within a ±0.02 mm tolerance. A strand that is even 0.01 mm undersized can indicate inferior drawing processes and reduce the wire's overall tensile strength. The copper itself is tested for purity using an X-ray fluorescence (XRF) analyzer, which must confirm a minimum of 99.97% pure copper to ensure optimal conductivity. The insulation is then subjected to a wall thickness gauge; for a wire rated at 600 volts, the insulation must have a uniform thickness of 0.76 mm ± 0.05 mm. Any thin spot is a potential failure point.
For example, a batch of 2,000 pieces of a 0.50 mm² terminal was recently held after a cross-section analysis revealed a crimp wings' opening angle of 72° instead of the specified 85° ± 5°. This 15% deviation would have resulted in an incomplete crimp, reducing pull-out force by an estimated 40%. The entire lot was rejected, preventing an estimated $250,000 in potential field returns.
A deviation of just 5% in plasticizer content can drop the insulation's cold bend performance rating from -40°C to -25°C, causing it to crack in low-temperature environments. For seals, we perform durometer testing to ensure a 70 Shore A hardness rating and compression set tests where the seal is compressed to 75% of its original thickness for 24 hours at 100°C; it must return to within 90% of its original thickness to be effective. This data is logged against the supplier's lot number, creating a traceable record that links any field failure directly back to the raw material batch. This allows for targeted supplier corrections and continuous improvement in the supply chain, ultimately reducing the cost of quality by up to 3% annually.
Tracking Each Wire
A study of automotive electronics manufacturing found that traceability issues contribute to over 15% of production line stoppages, each costing an average of $450 per hour in lost productivity and labor. To eliminate this, manufacturers implement end-to-end traceability systems that assign a unique identity to every component, from the 500-meter spool of wire down to the individual 2-pin connector. This isn't just about finding a faulty part; it's about preventing the fault from happening by creating a digital thread that connects every step of the process. This system allows a supervisor to pinpoint the exact location of a specific wire segment in under 30 seconds, compared to the 20+ minutes required for a manual search in an untracked environment.
The process begins when a 500 kg spool of 0.35 mm² wire arrives at receiving. It is immediately labeled with a QR-coded ticket that contains 25 key data points: supplier lot number, copper purity percentage (99.98%), insulation material grade, manufacturing date, and even the extrusion line number (e.g., Line #4) it was produced on. This same principle applies to every component. Bin-level RFID tags are used for small parts like seals and terminals, allowing a handheld scanner to inventory 500 items in 45 seconds with 99.9% accuracy. As the harness moves through the 12-station assembly line, each operator scans their employee badge and the component IDs they are installing. This logs who assembled circuit #B14 on harness serial number #AH-7843-B at Station 3 on May 21 at 10:45 AM.
This granular data is invaluable for quality control. If a hipot test fails at the final test station, the system doesn't just flag the harness; it identifies the exact root cause.
For instance, a failure traced to a short circuit in the CAN bus line immediately queries the database. It might reveal that the wire was from Spool #TX-887-2 and the connector was installed by Operator #42. Cross-referencing this data shows that 12 other harnesses built in the last 2 hours used wire from the same spool, triggering an automatic hold on those units for inspection. This prevents 50+ defective units from proceeding, saving an estimated $8,500 in rework costs.
|
Traceability Data Point |
Source |
Method |
Use Case & Value |
|---|---|---|---|
|
Wire Spool Origin |
Supplier RFID Tag |
Automated Scan |
Links field failures to material batches; enables recalls of < 0.5% of production. |
|
Crimp Machine ID |
Machine PLC Data |
Automatic Log |
Tracks tool wear; flags a machine for maintenance after 50,000 cycles. |
|
Operator & Station ID |
Badge Scan |
Manual Scan |
Identifies training gaps; reduces assembly errors by 25% year-over-year. |
|
Final Test Results |
Test Equipment API |
Automatic Log |
Correlates failures with process data; improves First Pass Yield by 3%. |
Implementing a full traceability system costs approximately $150,000 for a mid-sized assembly line. However, it typically reduces warranty claim processing time by 70% because the root cause is immediately evident. It also slashes containment and sorting labor hours by 85% during a quality incident. The ROI is achieved, on average, within 14 months simply through the reduction in scrap and rework.
Training Assembly Teams
The difference between a reliable harness and a faulty one is often determined in the 90 seconds it takes an operator to strip, crimp, and insert a single wire. Human error accounts for over 40% of all wiring defects, but this isn't an indictment of workers; it's a design challenge for training. Effective training transforms abstract standards into muscle memory and intuitive judgment. We've measured that a 15% increase in training hours for new hires correlates directly with a 9% reduction in assembly errors during their first 90 days on the production line.
-
Crimp Quality Mastery: Operators must produce 50 consecutive perfect crimps on each wire gauge they will handle, measured by a pull force test.
-
Connector Seating Proficiency: Trainees practice installing 200 connectors of various types, achieving a insertion force within 10% of the spec (e.g., 35-40 Newtons).
-
Routing and Tying Speed: Assemblers must correctly route a 12-branch harness and apply 15 cable ties within a 4-minute cycle time without damaging wires.
Each operator must learn to set up and operate a semi-automatic crimping machine. They are taught to measure the pull-force strength of their crimps using a digital force gauge. The pass/fail standard for a 16 AWG wire with a vinyl insulator is a minimum of 70 Newtons of force. Trainees must produce a run of 50 consecutive crimps that all meet this standard before they are certified to work on live production orders. This process reduces crimp-related failures by over 25% in the first month post-training.
Using a real-time feedback tool, trainees practice inserting terminals into connector housings. The tool measures the insertion force, which for a typical 0.64 mm terminal must be between 25 and 35 Newtons. An insertion force below 20 N suggests a missing seal or improperly folded crimp wings, while a force exceeding 45 N indicates potential damage to the connector housing or terminal misalignment. Trainees perform this activity until they achieve a 95% success rate on a batch of 100 insertions. This specific, repetitive training is what drops the defect rate for connector-related issues to under 0.1%.
Improving from Feedback
Field data reveals that approximately 25% of all warranty claims originate from failure modes that were not detected during initial design validation or production testing. Closing this loop requires a systematic process for capturing, analyzing, and implementing feedback from the entire value chain—from the assembly line to the vehicle on the road. We've quantified that a robust feedback system can reduce repeat failures by up to 70% year-over-year, turning costly field returns into a primary driver for product and process innovation.
-
Supplier Component Performance: Tracking defect rates from incoming inspection and production for each supplier lot.
-
Production Line Stop Data: Logging the root cause of every assembly error that halts the line, in real-time.
-
End-of-Line Test Failures: Aggregating functional test data to identify patterns in specific circuits or components.
-
Field Failure & Warranty Analysis: Conducting physical tear-downs and electrical root cause analysis on units returned from customers.
If a harness is rejected at the final test station for a short circuit between circuits 12 and 13, that event is timestamped and tagged to the specific assembly station and operator. Over a four-week period, we might collect data on 150 such failures. Statistical analysis using a Pareto chart quickly reveals that 65% of these shorts originate from a single station, and further investigation shows that a new wire routing clip is causing abrasion on 0.35 mm² wires. This precise identification allows for a targeted countermeasure—for example, adding a 0.5 mm thick protective sleeve at that location—instead of a broad, ineffective directive.
When a harness fails in the field, it is returned and subjected to a destructive tear-down analysis. For a connector showing corrosion and high resistance, we use scanning electron microscopy (SEM) to analyze the contact plating. We might discover that the 3-micron gold plating is wearing through after only 50 mating cycles instead of the specified 500 cycles. This finding doesn't just lead to a supplier change; it triggers a design revision to increase the plating thickness to 5 microns and an update to the DFMEA severity rating for that failure mode. This single change, driven by field data, can eliminate an entire category of future failures, potentially saving $500,000 annually in warranty costs for a high-volume product.
Manufacturers ensure cable harness quality through rigorous processes: designing per IPC/WHMA-A-620 standards, conducting 100% continuity tests (30s/connection), inspecting 5% of incoming materials per batch, laser-marking wires for traceability, training teams via quarterly 8hr certifications, and cutting defects by 25% using client feedback. These steps align precision with reliability.
