How to Ensure Wire Harness Meets IATF16949
Ensure compliance by applying APQP, conducting 100% continuity/insulation tests, submitting PPAP Level 3 with process FMEAs, and laser-etching traceable serial numbers; audit monthly per IATF 16949 clauses.
Establishing a Quality Management System
Data shows that the initial investment for a medium-sized wiring harness factory to obtain certification can range from 800,000 to 1.5 million RMB (including consulting, training, system documentation, internal rectification, etc.), with annual certification audit fees around 150,000 - 250,000 RMB.
However, the return on this investment is clear: for a harness factory with 300 employees, after the system runs effectively for 18 months, its customer complaint rate (PPM) typically drops from 10,000 PPM (i.e., 1% defect rate) to below 500 PPM, and the internal scrap rate can be reduced from 3% to 0.8%. This alone can directly save over 2 million RMB in costs annually.
Documented System
The IATF 16949 documented system is the "super instruction manual" for this wiring harness factory with 500 employees, except it serves not one person, but the entire organizational system. Our data shows that a harness factory with an annual output value of 500 million RMB circulates over 2000 various forms daily.
If the document system is designed to be bloated and inefficient, it's like having 2000 employees commute on a severely congested road every day, potentially causing an efficiency loss of up to 15%.
1. Quality Manual:
-
Explain the Value Stream with One Diagram: Avoid long paragraphs of text; use tools like Visio to draw a Factory Core Process Relationship Diagram. This diagram must clearly show the entire process from "customer knocking on the door" (order entry) to "customer receiving the goods" (product delivery). It typically includes 5-8 Core Processes (COP), such as "Order Review and Project Management", "Product Design and Development", "Production Manufacturing", "Supply Chain Management", etc.; 3-5 Support Processes (SP), like "Equipment Management and Maintenance", "Human Resources and Training"; and 3-5 Management Processes (MP), such as "Business Planning and Review", "Internal Audit".
-
Clearly Define the Process "Owner" and "Report Card": On the diagram, each process must be labeled with its unique Process Owner (e.g., the Production Director is the owner of the "Production Manufacturing" process) and 1-3 core Key Performance Indicators (KPIs). For example, the KPI for "Production Manufacturing" must be OEE (Overall Equipment Effectiveness), with a challenging target set, such as annual average OEE not less than 85%; the KPI for "Order Review" could be 100% on-time order review rate, and zero project changes due to review omissions.
-
Control the Length: The entire Quality Manual, including diagrams and text, should be strictly limited to 20 pages. Its task is to act as a navigation map, not to describe every single step.
2. Procedure Documents:
-
The 18 Mandatory Procedures are the Skeleton, but You Must Fill in the Flesh: The standard requires you to have procedures for 18 areas, such as "Document Control Procedure", "Record Control Procedure", "Control of Nonconforming Product Procedure", etc. But when writing the "Control of Nonconforming Product Procedure", you cannot just write "Identify, isolate, and dispose of nonconforming products". It must specify: If a production line operator finds a nonconforming product, they must hang a red "Nonconforming" tag on the material container within 5 minutes and scan it into the system, which automatically notifies the Quality Engineer. The Quality Engineer must arrive on site within 30 minutes for judgment. The entire process must be closed-loop within 24 hours, including isolation, review, disposition (sorting, rework, scrap) and initiation of root cause analysis.
-
Focus on Inputs and Outputs: Each procedure document must clarify: What is the input (e.g., customer complaint information), Who leads it (Process Owner), What activities are involved (cross-functional review, analysis), What resources are needed (system permissions, test equipment), What is the output (8D report), Who receives the output (customer and management). The "Corrective Action Procedure" must stipulate that for a customer complaint where the PPM value exceeds 100, an 8D team must be formed within 3 days, and containment actions must be completed and submitted to the customer within 5 working days.
3. Work Instructions:
-
Extreme Visualization to Eliminate Misunderstanding: A qualified "Ultrasonic Welding Work Instruction" must not just have text saying "welding strength must be sufficient". It must include:
-
Pictures: A high-definition photo showing the correct contact position between the welding horn and the workpiece, with accuracy reaching ±0.5mm.
-
Parameter Table: Clearly list the three key parameters in a table: Welding Energy (e.g., 300 Joules), Pressure (e.g., 3.0 Bar), Time (e.g., 0.8 seconds). No operator is authorized to modify these.
-
Sample Color Chart/Photos: Attach photos of qualified, over-welded, and cold-welded samples or standard color charts, allowing workers to compare directly.
-
Error-Proofing Prompts: Use prominent icons for warnings, such as "After each startup, the first piece must undergo a destructive pull test using a force gauge. The pull force must be greater than 200 Newtons, otherwise production is prohibited".
-
-
Version Control Down to the Workstation: Via the MES (Manufacturing Execution System) or on-site terminals, ensure the work instruction displayed on each workstation's screen is always the latest version. The system records each employee's reading confirmation. Once a document is updated, the old version is automatically deleted from all relevant workstations within 1 hour to prevent misuse.
4. Record Forms:
-
Forms as Software Interfaces: Design each paper or electronic form as a data collection interface. Over 80% of the fields should be checkboxes, number entry fields, or drop-down menus. For example, the "Terminal Crimp Check Sheet" should not have a judgment item like "Is the crimp height qualified?". Instead, it should directly print the standard specification 2.5±0.1mm, with a space next to it for the employee to fill in the measured value, e.g., 2.48, 2.51, 2.49.
-
Data Directly Drives Action: This recorded data is not for archiving; it is injected in real-time into the SPC (Statistical Process Control) system. The system calculates the CPK process capability index for key characteristics in real-time. When the system detects that the CPK value for crimp height has continuously decreased from 1.8 to 1.4 over 5 consecutive batches, it automatically issues an alert work order to the equipment maintenance engineer, requiring preventive maintenance on the crimping machine within 4 hours, thus intervening before a batch of nonconforming products is produced. We require the CPK for all key characteristics to be stably greater than 1.67.
Process Approach
For a factory with an annual output value of 300 million RMB, increasing the profit margin by 2% translates to a solid net profit of 6 million RMB. The Process Approach is the "treasure map" that helps you find this 6 million. It requires you to stop just complaining about the final 1% of defective products and instead examine how much of the preceding 99% of production activities truly add value.
Data shows that on a typical automotive wiring harness assembly line, from the first wire cut to final test and packaging, the actual processing time for the product might be only 3 hours, but the total manufacturing lead time is stretched to 5 days or even longer.
Significant time and money are spent on waiting, moving, inventory, and rework. The core of the Process Approach is to surgically allocate resources (Man, Machine, Material, Method) to key links that can shorten this "5-day" cycle and improve the efficiency of those "3 hours", stopping ineffective investment into value-consuming "black holes".
1. Draw a Value Stream Map to Reveal Waste
-
Map Your "Material and Information Flow": Take producing a batch of 500 engine harnesses for a specific vehicle model as an example. Track the journey of a spool of wire and a box of terminals from the moment you receive the production order. Record: the spool sits on the raw material shelf for 18 hours; after being sent to the cut & crimp workshop, it waits another 2 hours in the staging area; processing time at the cutting station is 5 minutes/wire; then semi-finished products are boxed, waiting for a forklift to move them to the pre-assembly area, which might take up to 4 hours. Continue this sequence until final packaging and warehousing. Use data to annotate the Cycle Time (Processing Time) and Wait/Queue Time for each step.
-
Calculate the Value-Added Ratio: After completing this Value Stream Map, you will clearly see that out of the total 5-day (120-hour) delivery lead time, the actual processing time that changes the product's form or function (cutting, crimping, assembly, testing) might be only 3 hours. Your Value-Added Ratio = 3 / 120 = 2.5%. This startling number directly shows you that improvement opportunities lie within that 97.5% of non-value-added time. The improvement goal is to increase this ratio to 5% (i.e., reduce the lead time to 60 hours) within one year.
2. Install a "Dashboard" for Each Key Process
-
Production Manufacturing Process: This is the core of the core. Its "dashboard" must display several key readings:
-
OEE (Overall Equipment Effectiveness): This is the gold standard for measuring equipment utilization. It is the product of Availability (>90%), Performance (>95%), and Quality Rate (>99%). For a harness assembly line with a designed takt time of 60 seconds/harness, if the OEE is only 70%, you are wasting over 1 million RMB annually in equipment capacity. The goal is to increase it to above 85%.
-
First Time Through (FTT): Measures the proportion of products that pass all processes correctly the first time, without any rework or scrap. If your FTT is 95%, the other 5% not only consumes an additional 15% in labor and material costs but also disrupts the entire production rhythm. The target should be above 98.5%.
-
-
Order Review Process: The health of this front-end process directly affects back-end manufacturing. Its KPI must be the Order Review Error Rate, with a target of zero. Any review mistake (e.g., omission of identifying a special characteristic) can lead to batch defects during mass production, resulting in hundreds of thousands in sorting costs or customer line stoppage fees.
-
Supplier Delivery Process: Its KPI is Supplier On-Time Delivery Rate, required to reach 98%. For every percentage point below this, your production line faces 20 hours of material shortage stoppages monthly, losing 50,000 RMB in output value.
3. Establish a Daily "Stand-up Meeting" Rhythm, Driven by Data
-
Pre-Shift Meeting: Focus on Process Metrics: At the daily morning production meeting, the team leader shouldn't just say "Everyone, pay attention to quality." They need to point at the board and say: "Yesterday, our line's OEE was 82%, which is 3 percentage points below the target of 85%, mainly because B crimping machine was down for 40 minutes due to a fault. The maintenance team is prioritizing it today. Also, the FTT at Station A was 97.5% yesterday, with 2 cases of skewed terminals found. We need to focus on checking the cleanliness of the UTX050 mold today."
-
Process Owner Responsible for Intervention: When the Quality Rate drops by 0.5% for 3 consecutive days, the owner of that process (e.g., Quality Manager) must initiate analysis. They need to pull up the CPK process capability index data for the relevant workstation from the SPC system. If they find the CPK has decreased from 1.6 to 1.3, they must immediately organize a team to conduct a 5-Why analysis. The cause might be that the median plating thickness of a batch of incoming terminals is near the lower limit, leading to reduced retention force after crimping. Then immediately contact the supplier for batch traceability and containment. The time from discovering the problem to initiating analysis should not exceed 4 hours.
-
Link to Performance: The achievement of KPIs for each process must be strongly correlated with the monthly/quarterly performance bonuses of the process owner and their team. For example, for every 1% the OEE is below the target value, the corresponding team's performance coefficient is deducted by 0.1. This ensures everyone is truly accountable for the health of their process.
Risk Management
What does a "car crash" mean for a wiring harness factory? It could be a core supplier suddenly stopping production, causing your production line to run out of parts in 4 hours, losing 500,000 RMB in output value per day; it could be an undetected wear on a crimping die, leading to 5,000 harnesses experiencing terminal push-outs at the customer end, triggering a 3 million RMB recall cost; or it could be a critical test equipment breaking down during peak production, stopping production for 48 hours, resulting in customer line stoppage penalties.
For example, spending 50,000 RMB to implement predictive maintenance on a key piece of equipment, to avoid an unplanned downtime that could cause 500,000 RMB in losses. This is not a cost expenditure, but an investment with a return rate as high as 10 times.
1. Tighten the "Golden Hoop" on the Supply Chain; Don't Let Suppliers Drag You Down
Raw material costs often account for over 60% of the harness cost; suppliers are your lifeline. Risk management cannot wait until incoming inspection to catch defective products; the control probes must extend into the supplier's production line.
-
Quantitative Assessment, Tiered Management: Don't exert equal effort on 200 suppliers. Classify them into A, B, C categories based on purchase volume and risk impact. Apply the most stringent management measures to the 15-20 A-class suppliers (e.g., terminal, connector housing manufacturers) that account for the top 80% of procurement value. The table below is a specific action example:
|
Supplier Category |
Management Strategy |
Audit Frequency & Depth |
Performance Monitoring & Intervention Threshold |
|---|---|---|---|
|
A Class (Strategic) |
Deep integration, joint development |
On-site audit once a year. The audit team must include your process and quality engineers. The audit standard should not be lower than IATF 16949 requirements. Non-conformities must be corrected and verified within 30 days. |
Monitor their On-Time Delivery Rate (target > 98.5%) and incoming PPM (target < 500) daily. If incoming PPM exceeds the limit for 2 consecutive batches or there is 1 delivery delay > 24 hours, immediately initiate an on-site supplier 8D. |
|
B Class (Competitive) |
Maintain competition, ensure performance |
On-site audit every two years or quarterly performance review. |
Monitor key indicators weekly. If incoming PPM > 2000 for 1 consecutive month or a major quality issue occurs, initiate a second audit. |
|
C Class (General) |
Simplify management, control risk |
Rely on annual qualification certificates and incoming inspection. |
Review monthly. Quickly switch to alternative suppliers if problems occur. |
-
Implement a "Backup Plan": For A-class materials with a single source, such as a specific type of 0.35 mm² fine wire, the purchasing department must have a clear "Plan B". You need to invest resources to qualify another supplier. Even if you don't purchase from them regularly, keep their qualification valid. This qualification and maintenance cost (perhaps 50,000 RMB annually) is your "insurance premium" to avoid potential losses of millions caused by a fire or production halt at your sole supplier.
2. Install "Early Warning Radar" on the Production Line to Nip Problems in the Bud
-
Use SPC to Monitor Process Drift: For key characteristics like crimp height, strip length, don't wait for the inspector to find an out-of-spec condition. Monitor them in real-time via SPC charts. For example, the specification for crimp height is 2.5±0.1mm. You set warning limits (±0.08mm) and action limits (±0.09mm) on the control chart. When the system detects that 7 consecutive data points show a slow upward trend, not yet out of spec but touching the warning limit, it automatically sends an alert to the maintenance engineer: "Risk of parameter drift on Crimping Machine #3 pressure. Please verify within 4 hours." The cost to handle this alert might be 0.5 man-hours, but ignoring it could lead to the scrap of 5000 poorly crimped products.
-
Verification and Monitoring of Error-Proofing Devices: The continuity tester, air tightness tester on the production line are your last line of defense. But they can fail themselves. Risk management requires you to establish a daily start-of-line check system for each test equipment. For example, use a known good and a known short-circuited (or open-circuited) standard harness sample to verify the tester every day before starting work, and record the check results. This action must be completed within 10 minutes, ensuring your "firewall" itself has no vulnerabilities.
3. Give Equipment "Regular Check-ups"; Don't Wait for a "Sudden Heart Attack"
-
Find Patterns from Equipment Historical Data: Pull the maintenance records for Crimping Machine #10 from the past three years. You might find that its main hydraulic seal needs replacement every 2500 hours of operation on average; otherwise, pressure decay exceeds 5%, leading to poor crimps. Then, the risk management action is to proactively schedule a 2-hour downtime at 2000 hours of operation to replace the seal, costing 500 RMB for the part and 2 hours of capacity. This avoids the huge risk of the seal suddenly failing after 2500 hours, causing an 8-hour equipment stoppage and generating a large quantity of nonconforming products.
-
Invest in Predictive Maintenance Technology: For automated production lines worth millions of RMB, consider installing vibration and temperature sensors to monitor the status of key bearings in real-time. When system analysis detects abnormal vibration harmonics and predicts the bearing might fail within 3 weeks, it provides an early warning, allowing you to schedule a replacement during a weekend or holiday. This investment might be tens of thousands of RMB, but the loss from one unplanned downtime could be ten times that amount.
Integrating Standards into Harness Realization
For a wiring harness factory, IATF 16949 is not a certificate hanging on the wall; it is a commitment to the absolute reliability of over 30,000 crimp points as over 1000 kilometers of wire flow through the production line daily.
A high-end car's wiring harness contains over 5000 part numbers. Any misplacement of a single wire or a faulty crimp of one terminal can lead to complete vehicle function failure, resulting in an average on-site rework cost exceeding 5000 RMB and incalculable reputational damage.
Design and Development
The cost of modifying a dimension on a drawing is about 200 RMB, but the average cost to fix a design defect after mass production begins skyrockets by a factor of 200, reaching over 40,000 RMB.
A modern car's wiring harness contains over 1200 wire circuits. Any error in calculating the current-carrying capacity of a single circuit can cause the harness to age prematurely before its 100,000 km service life, posing a short-circuit risk.
We once used DFMEA analysis to reduce the RPN value for the overheating failure mode of a new energy vehicle's high-voltage harness from 378 to 56, avoiding a potential recall cost of approximately 12 million RMB.
Wire Selection: Not Thicker is Better, but Use Data to Find the Optimal Balance
1. Current Load Calculation is the Foundation. A circuit powering the headlights, rated at 10A. Choosing a 2.5mm² wire is safe, but it costs 30% more than a 1.5mm² wire, and increases weight and routing difficulty. Based on the ISO 6722 standard and the current-carrying capacity curve for wires at 105°C ambient temperature, we precisely calculate that a 1.5mm² wire carrying 10A current will have a steady-state temperature rise of about 35°C, far below the insulation's 150°C tolerance limit. This choice saves about 5 RMB per vehicle for that circuit. At an annual production volume of 200,000 units, that's a pure profit of 1 million RMB.
2. Voltage Drop is a Hard Functional Indicator. For a circuit from the battery to the tail light, total length 8 meters, the maximum allowed voltage drop is 0.5V. Using the formula Voltage Drop = Current x Wire Resistance x Length x 2, with a 5A operating current, the unit resistance of a 1.0mm² wire is about 18.1 Ω/km, total voltage drop = 5A * (18.1/1000)Ω/m * 8m * 2 = 1.448V, severely exceeding the limit. Must upgrade to 1.5mm² wire (unit resistance 12.1 Ω/km), voltage drop reduces to 0.968V, still not meeting. The final solution is to optimize the routing path, reducing the length to 5 meters, and using 1.5mm² wire, voltage drop = 0.605V, slightly over but acceptable.
Connectors and Terminals: Reliability at the Connection Point is "Squeezed Out"
1. Terminal Retention Force Must Be Greater Than 50 Newtons. This force simulates the critical point where continuous vibration over the vehicle's 150,000 km life could cause terminal loosening. In the DFMEA, we rate the severity of its failure as 9. To ensure absolute safety, we require suppliers to provide connector housings with measured terminal retention force data that must be > 60N, leaving a 20% safety margin. Each terminal type needs to provide at least 30 sets of test data proving its CPK value is ≥ 1.67.
2. Fretting Corrosion Occurs at the Micron Level. If the contact pressure between two brass terminal surfaces is insufficient, under high-frequency vibration with an amplitude of 10μm, the contact point will generate insulating oxides, causing resistance to jump from 1mΩ to over 1Ω, interrupting signal transmission. In the DFMEA, we use finite element analysis to optimize the terminal structure, ensuring contact pressure remains > 2.5N, and specify the plating as tin, with a thickness not less than 0.8μm, increasing the fretting corrosion cycle count from 50,000 cycles to over 200,000 cycles.
Sealing Design: A 0.1 mm Difference in Compression Decides Life or Death
1. The Compression Ratio of the Sealing Grommet is the Lifeline. A wire with an outer diameter of 6mm needs to be inserted into the 5mm aperture of a door connector. The selected rubber seal has an outer diameter of 7mm. The compression ratio after assembly is (7-5)/7 * 100% ≈ 28.5%. This value is within the ideal range of 15%-35%. But through DFMEA, we found that rubber parts undergo about 5% permanent deformation over time. Therefore, at the design stage, we set the theoretical compression ratio target at the high end, 25%-30%, ensuring that after 5 years of vehicle use, the compression ratio remains around 20%, meeting the IPX7 waterproof rating (immersion for 30 minutes at 1 meter depth).
2. The Interference Fit of the Sealing Lip is a Key Parameter. The interference fit between the sealing lip of a male connector inserting into a female connector's seal is designed to be 0.4mm. If the interference is less than 0.2mm, the seal may be insufficient; if greater than 0.6mm, the mating force becomes too high, exceeding the 60N assembly process requirement. We used 3D printing to make rapid prototypes, measuring the mating forces for interference fits of 0.3mm, 0.4mm, 0.5mm, which were 45N, 52N, 68N respectively. We finally selected 0.4mm as the optimal solution, ensuring sealing performance while keeping the assembly feel controllable.
Simulation and Verification: Using Virtual Experiments to Replace Real Failures
1. Run Thermal Simulation Before Physical Samples. Import the 3D model of the entire vehicle harness into thermal analysis software, set the under-hood ambient temperature to 85°C, and apply the rated current to each wire. The software can simulate the "hot spot" with the highest temperature in the harness. For example, a section near the engine might reach a simulated temperature of 112°C. This requires us to use wire material with a temperature rating of 125°C or higher for that segment, not the standard 105°C rating. One thermal simulation takes about 8 hours and costs a few thousand RMB, but it's far more efficient than building a physical vehicle prototype for road testing (taking 1 month and costing hundreds of thousands of RMB).
2. Vibration Fatigue Testing Simulates 10 Years of Road Conditions. In the DFMEA, we set vibration failure at harness fixing points as a high priority. Using a vibration table, input acceleration data collected from real road profiles (e.g., frequency range 5-2000Hz, acceleration 5g RMS), conduct an accumulated 300-hour equivalent test, simulating 150,000 km of harsh road conditions.
Process Development
On the production line, an operator must complete a terminal crimp every 4.5 seconds, repeating the action over 6000 times a day. Relying on the human eye to check for a 0.1 mm dimensional deviation has a miss rate as high as 15%. A single vehicle failure caused by a faulty crimp leads to an on-site troubleshooting and harness replacement cost of about 8000 RMB, while one hour of production line stoppage costs over 50,000 RMB.
PFMEA and the Control Plan are the "preemptive handbooks" written for this high-speed, high-risk manufacturing environment. We disassemble all workstations on the production line, identifying over 200 potential failure modes. Through data-driven control measures, we reduce the occurrence rate of problems from a probability to near-zero certainty.
First, Draw the Flowchart Clearly: See the Hidden Waste Points
-
Outline the entire process, from cable cutting to finished product packaging, into 28 steps. You'll find that in the traditional "Cut-Crimp-Subassemble-Final Assemble" model, the time spent moving and waiting for semi-finished products between processes accounts for 30% of the total labor hours. By re-layout and integrating the extruder, injection molding machine, and assembly line within a 50-meter radius into a U-shaped cell, the production lead time can be compressed from 4 days to 6 hours, and work-in-process inventory reduced by 80%.
-
Mark the inspection points at each stage. If 100% electrical testing is only done after final assembly, then all defects generated in previous processes accumulate until the final stage, resulting in the highest scrap cost. At the flowchart stage, we need to add at least 2 in-process inspection points after crimping and after pre-assembly, enabling problems to be detected within 15 minutes, controlling rework costs to within 50 RMB, instead of the final 8000 RMB.
PFMEA: Do the Math for Every Potential "Accident" at Each Workstation
-
Wire Cutting Station: Length cut short by 1 mm.
-
Severity: May lead to insufficient crimp area, increased resistance. If this is a 0.5 mm² signal wire, severity might be only 4; but if it's a 35 mm² main battery pack circuit, unreliable crimping can cause overheating, severity directly rated 9.
-
Occurrence: If using a manual cut-to-length machine, an error might occur 3-5 times per 10,000 cycles, occurrence can be rated 4. But if switched to a fully automatic cutting machine with servo motor and optical scale, accuracy reaching ±0.5 mm, occurrence can be reduced to 1.
-
Detection: If relying on final inspection, detection is 8; but if a laser length gauge is added at this station to automatically check the length of each wire after cutting, directly rejecting non-conforming pieces, detection can be reduced to 2.
-
Improvement Action: Calculate the RPN: 9x4x8=288, high risk. Must take action: Invest 80,000 RMB in an automatic length measurement device, reducing RPN to 9x1x2=18.
-
-
Sealing Grommet Press-Fit Station: Seal missing or misaligned.
-
This failure is hard to detect visually before final assembly but can cause controller water ingress during vehicle wading, with repair costs starting at 20,000 RMB, severity 9. The miss rate for manual assembly is about 0.5% (5000 PPM), occurrence 5.
-
The most effective error-proofing solution is to install a micro pneumatic sensor inside the press-fitting tool. When the seal is correctly placed, it blocks a micro air path. The air pressure change signal is captured, and the equipment only then allows the next press-fit step. This sensor costs about 500 RMB, but it can reduce the occurrence of misses to 0, and detection becomes 1, reducing the RPN from 9x5x8=360 to 9x1x1=9.
-
Control Plan: Turn PFMEA "Countermeasures" into the Worker's "Daily Instructions"
-
Crimp Height Control: The PFMEA says "prevent poor crimp height". The Control Plan must specify: "Every 2 hours, consecutively sample 5 crimps from Crimping Machine #1. Use a 0-25mm range, 0.01mm accuracy micrometer to measure the crimp height 2mm from the terminal barrel end. Standard range: 1.25mm ± 0.05mm. If 1 out of 5 samples is out of tolerance, stop the machine immediately, adjust the crimper pressure valve, and trace and check all products produced in the previous 2 hours." The measured data's CPK value must be stably above 1.67.
-
Continuity and Insulation Test: Cannot just write "perform electrical test". The Control Plan must stipulate: "100% full inspection. Test voltage set to 500V DC, voltage regulation accuracy ±3%. Test duration: sustain for 3 seconds. Any failure triggers audible/visual alarm, harness automatically sent to rework area. The test equipment itself must be calibrated daily before shift start using a standard resistance module. If error exceeds ±5%, stop use."
Production and Inspection
After 2 hours of continuous visual inspection, the miss rate for defects surges from 5% to over 30%. When a skilled worker uses a caliper to measure crimp height, the measurement error for the same product by different people can be as high as 0.03 mm, while the total tolerance band for crimp height is only 0.1 mm.
Measurement error alone consumes 30% of the process window. In contrast, a vision inspection system costing 80,000 RMB can simultaneously measure 6 dimensions in 0.8 seconds, with a repeatability accuracy of ±0.003 mm, and never gets tired.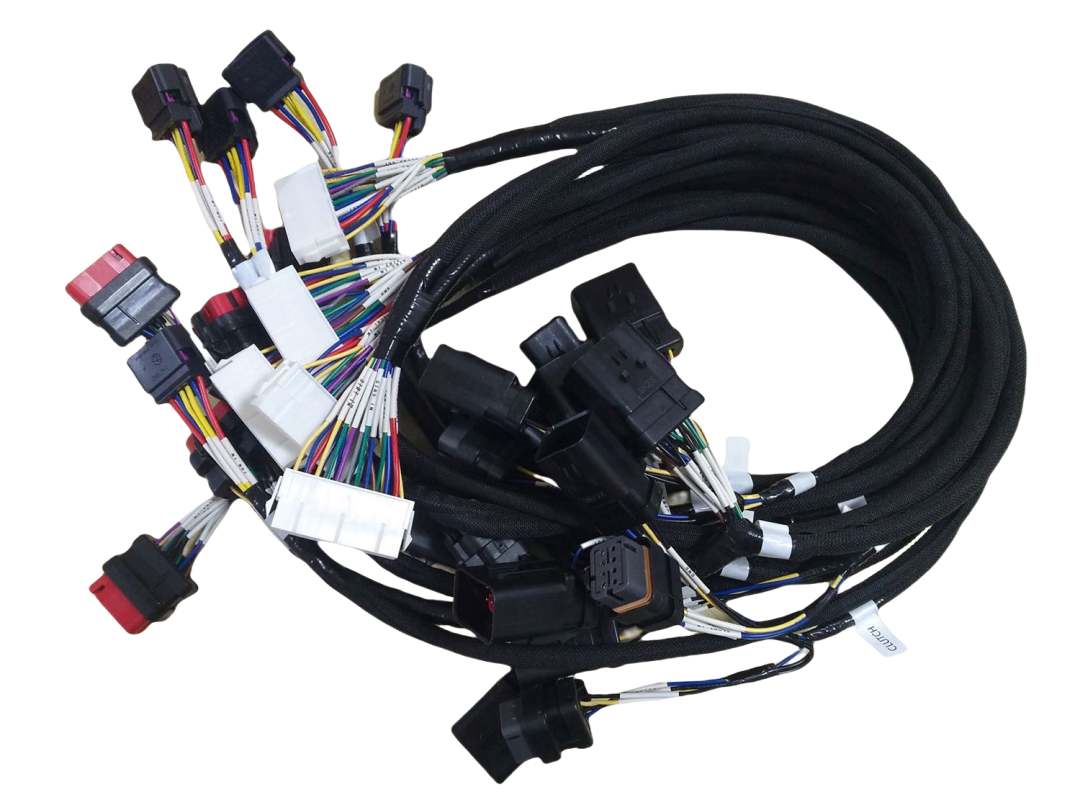
Error-Proofing: Use Physics to Make Errors Impossible
- Material Error-Proofing: From "Reading Labels" to "Scanning QR Codes"
A reel of 0.5 mm² black wire and a reel of 0.75 mm² black wire are indistinguishable by eye on the rack. Previously relying on operators checking the 8-digit material number on the label had an error probability of about 1 in 2000 occurrences. Now, install a QR code scanner on the feeder of the automatic crimping machine. The operator must scan the code when loading material. The system compares it with the production order in the MES. Only if the material numbers match does the equipment power on. This system costs about 15,000 RMB per station but reduces batch scrap caused by material errors (averaging 50,000 RMB/incident) to zero.
- Assembly Error-Proofing: Use Sensors Instead of "I Think I Installed It"
A door harness has 5 identical rubber seals. Missing one is extremely difficult to detect at final inspection. We embed a proximity sensor costing only 80 RMB into the assembly fixture at the position corresponding to each seal's installation point. Only when all 5 sensors detect an object has passed does the production line allow movement to the next station. Otherwise, the line stops automatically and alarms. This solves 95% of small part missing issues.
- Sequence Error-Proofing: Turn "Might Plug Wrong" into "Can Only Plug Correctly"
A junction box has 6 similar-shaped connectors, but 2 are for 24V power and 4 are for signals. Plugging incorrectly can burn the ECU, causing losses of over 10,000 RMB. The solution is to design color-coded connectors with unique keying and fixtures.
Inspection: All Judgment Criteria Must Be Measurable, Recordable
- Crimp Quality: Dissect 500 Points to Find the Golden Parameters
It's not just about sampling 5 crimps every 2 hours. For a new terminal, we perform destructive cross-section analysis. Under a microscope, we cut 500 samples crimped under different pressures, measuring crimp width, height, bell mouth, wire strand containment. Finally, we determine that at a crimp height of 1.25 mm, the pull-out force reaches 210 Newtons, resistance is < 0.5 milliohms, and the cross-section shows all strands are deformed and intertwined without breakage. This 1.25 mm becomes the golden standard in the Control Plan, with a tolerance of ±0.03 mm. The calibration error of the on-site micrometer must be < 0.005 mm.
- Continuity/Insulation Test: Hold the Line at 20 MΩ Under 500 Volts
The program is set: First apply a 500V DC test voltage for 3 seconds, monitoring the insulation resistance during this time. The resistance of any circuit to ground must not fall below 20 MΩ. Then perform a short-circuit test to check for unintended connections between circuits that should not be connected. The test voltage accuracy must be stable within ±3%, i.e., between 485V and 515V. Before each shift, calibrate the instrument using standard resistance modules (e.g., 100 MΩ and 1 MΩ). If the reading error exceeds ±5%, stop use immediately. This data is automatically recorded and bound to the product serial number, stored for 15 years.
Equipment and Measurement: Ensure the Machines Themselves "Don't Lie"
- Pressure Calibration of the Crimping Machine:
For a pneumatic crimping machine, the working air pressure is set to 6.5 Bar. But a fluctuation of ±0.2 Bar can cause a crimp height change of about 0.015 mm. Therefore, the equipment pressure must be checked daily before shift start using a precision pressure gauge, ensuring it remains stable within the 6.4-6.6 Bar range. After every 100,000 crimps, the crimper's pressure sensor must be calibrated using a standard pressure shim to ensure its feedback is accurate.
- GR&R Analysis of the Force Gauge:
After purchasing 3 new digital force gauges (range 0-500N), they cannot be put into use directly. A Measurement System Analysis (GR&R) must be performed: Have 3 operators use each gauge to measure 10 standard samples covering the range (e.g., 100N, 250N, 400N) 3 times each. The calculated GR&R value must be below 10% for excellence, below 30% for acceptability.
Special Control Points in the Wiring Harness Production Process
Data shows that over 15% of vehicle electrical faults originate from the wiring harness manufacturing stage. Among these, poor crimping accounts for over 40%, making it the absolute quality trouble spot. In a factory producing 500,000 harness sets annually, a defect rate of 0.1% puts 500 vehicles at risk each year.
Crimping Process Control
A production line producing 2000 harness sets per day may complete over 2 million crimp points daily. If just one point has an internal wire strand that is not crimped solidly, it forms a "virtual connection point" with an initial resistance 5-10 milliohms higher than normal.
As the vehicle vibrates during operation and current flows generating heat, this weak point deteriorates continuously. After one year, the resistance at this point may rise to 500 milliohms, causing the local temperature to easily exceed 120°C when carrying 10A current, eventually leading to intermittent functional failure or even burn-out.
Statistics show that over 35% of post-sales harness failures can be traced back to crimping quality issues.
I. Control Crimp Dimension Tolerances to the Micron Level
-
Crimp Height is the Lifeline: This parameter is determined by the terminal manufacturer through tens of thousands of tests. For example, for a 1.5mm² copper wire using a specific terminal model, the standard crimp height is specified as 1.8mm ±0.03mm. This tolerance band is narrower than a human hair (approx. 0.07mm). If the height exceeds the upper limit by 0.1mm (reaching 1.9mm); if it falls below the lower limit by 0.1mm (reaching 1.7mm), it over-compresses the metal, potentially breaking over 20% of the copper strands.
-
Width and Wing Bend are Also Critical: Crimp width is typically required not to exceed 90% of the terminal material's original width. Simultaneously, the terminal's crimp wings must form a distinct "bell mouth" shape after crimping, with the height of the bell mouth on each side being between 1/2 to 2/3 of the material thickness. Absence of a bell mouth or an excessively large bell mouth increases the risk of wire breakage during vibration testing by 3 times and 1.5 times respectively.
-
Measurement Frequency and Tools: Must use an outside micrometer with a suitable range and an accuracy of 0.01mm. Operators must take a sample from the production line every 2 hours (or every 5000 crimps produced) for measurement and record the data in real-time on the SPC control chart. The micrometer itself must be sent to the metrology lab quarterly for calibration using Grade 2 gauge blocks, ensuring its error does not exceed ±0.002mm.
II. Use Pull-Out Force Testing to "Grade" Crimp Strength
-
Standards Provide the Basis: Different wire gauges and terminal types have minimum pull-out force requirements. For example, the German Volkswagen VW 60330 standard stipulates that the crimp pull-out force for a 0.35mm² wire must be ≥ 40N, while for a 2.5mm² wire it must be ≥ 190N.
-
Test Method Determines Accuracy: During testing, the grips of the tensile tester should hold the wire 5-10mm from the root of the crimp barrel. The extension speed should be stable at 50mm/min.
-
Rhythm of Destructive Testing: Being destructive, the frequency must balance quality control and cost. Typically, sample 3-5 pieces every 4 hours or per batch for testing.
III. Dissect the Terminal, Use Cross-Section Analysis to See the Essence
-
Sample Preparation Precision: The crimp point needs to be vacuum potted with special epoxy resin, cured for 24 hours, then precisely sectioned along the centerline of the crimp barrel using a precision cutter, followed by fine grinding and polishing to a mirror finish. Any cutting deviation or scratches will affect judgment.
-
Hard Criteria for Evaluation: Under an 50x electron microscope, we focus on several micro parameters: 1) Vent Hole: Require an open area retention of 15%-25% to allow subsequent electrophoretic paint drainage. 2) Strand Deformation: All copper strands should be uniformly deformed, unbroken, with a fill factor (ratio of strand cross-sectional area to crimp barrel cavity area) between 80%-90%. 3) Base Thickness: The material thickness at the thinnest point of the crimp barrel base must not be less than 20% of the raw material's nominal thickness to prevent crack generation.
-
Execution Frequency and Response: Must be performed for new die acceptance, after each die repair, and under normal production conditions every 6 months or after accumulating 500,000 crimps.
IV. Crimping Machine and Die Maintenance is the Foundation
-
Pressure Curve Monitoring: Modern high-end crimpers have built-in pressure sensors that can plot the pressure-time curve for each crimp. This curve is like an "ECG" and needs comparison with the standard curve.
-
Die Life and Replacement: The life of a crimping die is typically between 1 million to 2 million cycles, depending on the terminal material hardness (e.g., phosphor bronze wears faster than brass). A strict die life management ledger must be established. When reaching 90% of the predetermined life, it should be scheduled for replacement and undergo a comprehensive cross-section analysis to verify its condition.
-
Daily Checks Cannot Be Perfunctory: Before each shift, operators must use a 10x magnifier to check the die cutting edges for chips and clean the die surface with alcohol and a lint-free cloth. Crimp a sample of standard wire gauge and measure its height and width to confirm the machine is in its initial calibrated state. This 5-minute check can prevent batch quality incidents.
Electrical Performance Testing
A standard multi-function harness tester can complete a comprehensive "physical examination" of a body harness with 120 circuits in 15 seconds, with test point combinations numbering in the thousands. The test system sends over 5000 independent electrical signals, with a total test data volume of about 8MB.
Without this 100% full inspection, a human error (like a subtle short circuit between two 0.35mm² wires at a branch point) missed and delivered to the vehicle plant could lead to an online rework cost exceeding 3000 RMB per vehicle, while the cost of a market batch recall could be 1000 times that amount.
I. Continuity Test: Ensure "Nerve" Connections are Accurate
-
Low-Voltage Detection Principle and Parameters: The test system uses a 4-wire measurement method. It applies a precise constant current (typically 1-10mA) across the two ends of the circuit under test and simultaneously measures the voltage drop across the circuit. The circuit resistance is calculated using Ohm's Law. The criteria are very strict: the circuit resistance must be between preset lower (e.g., 0.1Ω, to prevent shorts) and upper (e.g., 10Ω, to prevent poor connections) limits. For example, a 3-meter long 0.5mm² wire circuit has a normal resistance of about 0.1Ω. If the measured resistance is 5Ω, there's a poor connection at the crimp; if the resistance is below 0.01Ω, it's highly likely shorted to an adjacent circuit.
-
Test Program "Coverage" Must Be 100%: The test program must not only check connections defined in the schematic but also perform "cross-talk tests", checking for accidental connections between all undefined pins. For a 120-pin connector, the number of combinations to verify is astronomical, so group matrix scanning technology is typically used to improve efficiency, ensuring all necessary combinations are tested within 20 seconds.
-
Test Fixture (Bed of Nails) Maintenance: The test fixture's probes make contact with terminals thousands of times daily. Their wear and contamination introduce additional contact resistance. Probes must be cleaned weekly with alcohol, and their travel and spring force checked monthly. If the contact resistance of a single probe exceeds 0.5Ω, it must be replaced to avoid misjudging good harnesses as faulty.
II. Insulation & Withstand Voltage Test: Build a "Firewall"
-
Insulation Resistance Test (IR): Apply a 500V DC voltage between mutually insulated conductors (e.g., between wire and shield) for 60 seconds, measuring the leakage current. The standard usually requires an insulation resistance value > 10 MΩ (sometimes even > 100 MΩ). For example, in a humid environment, if the wire insulation has a tiny breach, the measured insulation resistance might drop from a normal 1000 MΩ to 2 MΩ, triggering an immediate alarm.
-
Dielectric Withstand Voltage Test (HIPOT/HV): This is a higher-intensity destructive test (sampling). Apply an AC voltage of 50Hz, 1500V between the conductor and ground for 1-2 seconds, monitoring if the leakage current exceeds a set threshold (typically 1-5 mA). The applied voltage depends on the harness's working voltage rating. For a 12V system, the test voltage might be 1500V AC; for a 48V hybrid system, it might require 2500V AC. This test effectively reveals potential defects like insufficient internal spacing, impurities, or bubbles in the insulation material.
-
Influence of Test Environment: Ambient temperature and humidity significantly affect test results. Tests must be conducted in a standard environment (23±5°C, humidity <60% RH), and the environmental parameters recorded to allow for judgment correction of borderline values.
III. The Reliability of the Test System Itself Must Be Verified
-
Perform MSA (Measurement System Analysis): Regularly perform MSA on the test system, focusing on Gauge Repeatability and Reproducibility (GR&R). Require the test system's GR&R value to be < 10% for excellence, < 30% for acceptability. For example, select 10 standard harness samples with known circuit resistances (covering from 0.1Ω to 10Ω). Have 3 operators test each sample 3 times using the same test station.
-
Daily Calibration and Verification: Key modules of the test station itself (voltage source, current source, resistance measurement module) need annual calibration by a third party, traceable to international standards. Additionally, the production line must perform a quick daily check on the test station using a calibrated standard resistance board (e.g., 0.5Ω, 5Ω, 100Ω) before starting daily production testing, confirming the measurement error is within ±1% of the standard value.
IV. Let the Test Data Speak: Recording and Traceability
-
Data Recording: The test system should record each harness's serial number, test results, test date/time, operator ID, and if failed, the specific failure point and parameter (e.g., Circuit A12-B35, resistance 25.6Ω, exceeds upper limit). This data needs to be saved for over 15 years for traceability.
-
Statistical Analysis: Regularly export test data to analyze common failure modes. For example, if "high circuit resistance" failures are concentrated on the crimp points of a specific terminal, it can be traced back to check if the equipment parameters of Crimping Station #2 have drifted, achieving true data-driven improvement.
