Questions to ask Wire Harness manufacturer | 7 examples
When evaluating a wire harness manufacturer, ask about their IPC/WHMA-A-620 compliance, crimp force monitoring (0.5-1.5 kN range), and automated testing (e.g., 500V hipot checks). Confirm lead times for 24-hour prototypes or 10,000-unit batches, and request MTBF data (>100,000 cycles) for critical applications like automotive or aerospace.
Materials Used
When choosing a wire harness manufacturer, the materials they use directly impact performance, durability, and cost. A typical automotive wire harness contains 60-70% copper conductors, 20-30% insulation (PVC, XLPE, or TPE), and 5-10% shielding (aluminum foil, braided copper, or conductive polymers). Low-quality materials can lead to 15-25% higher failure rates within the first 5 years, while premium-grade components can extend lifespan to 10-15 years with <1% annual defect rates.
For example, 16 AWG copper wire (1.29 mm² cross-section) is common in 12V automotive systems, handling up to 22A continuous load, while 24 AWG (0.205 mm²) is used for low-power signals (<3A). Insulation thickness varies from 0.15 mm for lightweight applications to 0.5 mm for high-abrasion environments. Cheap PVC insulation degrades at 85°C, whereas cross-linked polyethylene (XLPE) withstands 125°C+, reducing thermal failure risks by 40%.
Shielding effectiveness is critical in EMI-sensitive applications. A 90% coverage braided shield reduces interference by 30-50 dB, while foil shields offer 60-70 dB attenuation but are less flexible. Connector materials also matter—nickel-plated brass lasts 50,000+ mating cycles, versus 30,000 for tin-plated versions.
Cost differences are significant. Oxygen-free copper (OFC) costs 20-30% more than standard electrolytic copper but improves conductivity by 5-8%, reducing energy loss in high-current applications. For extreme environments, fluoropolymer insulation (PTFE/FEP) adds 50-100% to material costs but resists chemicals, UV, and temperatures up to 200°C.
Manufacturers cutting corners with recycled copper (95% IACS conductivity vs. 100% for pure copper) or substandard plastics risk 10-15% voltage drop over 10-meter runs, leading to sensor errors or power delivery issues. Always verify material specs—UL, ISO 6722, and SAE J1128 certifications ensure compliance with automotive/industrial standards.
For high-voltage EV harnesses, 600V-rated XLPE insulation is mandatory, with 2.5 mm² minimum wire size for 50A circuits. In contrast, data harnesses use 28 AWG twisted pairs (0.08 mm²) with 100Ω impedance tolerance (±5%) for signal integrity.
Testing Methods
Wire harness failures can cost manufacturers $50,000+ per recall in automotive applications, making rigorous testing non-negotiable. A typical 1000-unit production batch undergoes 8-12 different tests, with 3-5% of samples subjected to destructive analysis. High-reliability industries (aerospace, medical) test 100% of units, while commercial applications use AQL sampling (Level II, 1.5% defect tolerance).
| Test Type | Parameters Measured | Pass/Fail Criteria | Industry Standard |
|---|---|---|---|
| Continuity Test | Resistance (<0.5Ω per 1m wire) | Open/short circuits (±5% tolerance) | IEC 60512-2-1 |
| HiPot Test | Dielectric strength (500V-5kV AC/DC) | No breakdown at 1.5x operating voltage | UL 758, ISO 6722 |
| Pull Test | Tensile force (50-200N per wire) | No detachment at 2x max expected load | SAE J1128 |
| Flex Test | Bend cycles (50,000+ for automotive) | No conductor breaks after 10k cycles | IPC-WHMA-A-620 |
| Salt Spray Test | Corrosion resistance (500+ hours) | <5% surface oxidation after 96h | ASTM B117 |
Continuity testing catches ~70% of manufacturing defects (miswires, cold solder joints) by checking resistance. A 12-circuit harness should show <10mΩ between mating connectors, with deviations >10% flagging potential crimping issues.
HiPot (high potential) testing applies 1.5kV AC for 60s to insulation, detecting microscopic cracks that cause >500mA leakage currents. Medical-grade harnesses require 3kV isolation, while automotive specs (LV124) demand 2.5kV surges.
Mechanical stress tests simulate real-world abuse. A 150N pull force on a 4mm² cable for 30s ensures terminals won’t detach in engine vibrations. For flex-heavy applications (robotics, doors), ±90° bends at 0.5Hz for 50k cycles verifies strand integrity—failed tests often show >20% resistance increase.
Environmental testing exposes weaknesses. Thermal cycling (-40°C to +125°C, 1,000 cycles) checks for insulation cracking, while 85°C/85% humidity aging accelerates corrosion. Harnesses failing >5% of dielectric tests after 500h indicate poor material selection.
EMI/RFI testing uses 1-18GHz frequency sweeps to measure shielding effectiveness. A 60dB attenuation at 100MHz is mandatory for military (MIL-STD-461), whereas automotive (CISPR 25) allows 40dB.
Automated optical inspection (AOI) scans for 0.1mm misalignments in connector pinouts, catching ~15% of defects missed by electrical tests. For high-volume orders, inline testing (500 harnesses/hour) combines continuity, HiPot, and impedance checks in <10s per unit.
Cost vs. Coverage: 100% testing adds 0.50-2 per harness, but reduces warranty claims by 30-50%. Sampling cuts costs by 60%, but risks 0.1-0.5% defect escape rates—unacceptable for safety-critical systems. Always demand test logs with timestamps, operator IDs, and raw data—not just a "passed" stamp.
Production Capacity
When evaluating a wire harness supplier, production capacity isn’t just about "how many"—it’s about how fast, how consistent, and how scalable they can be. A mid-sized factory with 50-100 workers typically produces 5,000-10,000 harnesses per day, while larger facilities with 300+ employees can hit 50,000+ daily units. But raw output numbers don’t tell the full story.
"A supplier claiming ‘unlimited capacity’ either has massive idle machinery or isn’t being honest. Real scalability means maintaining ≤2% defect rates at 120% workload for 3+ months."
Lead times vary wildly based on complexity. A simple 10-wire automotive harness takes 2-3 days from order to shipment in high-volume production, while a custom 200-pin aerospace harness with 0.05mm tolerance requirements can stretch to 8-12 weeks. Factories running 3 shifts (24/5 operations) cut delivery times by 30-40% versus single-shift shops.
Automation levels directly impact speed and consistency. Semi-automatic crimping machines process 800-1,200 terminations/hour with ±0.1mm precision, versus 300-500/hour for manual setups. Fully automated lines with vision-guided robotic assembly can produce 5,000+ complex harnesses/day with <0.5% rework rates, but require 2M-5M in equipment investments.
Material staging separates pro from amateur operations. Top-tier suppliers keep 15-30 days of raw inventory (copper, connectors, sleeves) to absorb ±20% demand spikes, while cheaper shops run just-in-time with 3-5 day buffers—risking 2-week delays when Taiwan’s copper prices jump 10% overnight.
Floor space utilization reveals efficiency. A well-organized 10,000 sq ft plant should output 3M/month in harnesses, with 40% of space dedicated to QC stations and ESD-protected sub-assembly zones. Crowded factories squeezing 5M/month into 8,000 sq ft often show 15-25% higher defect rates from cross-contamination.
Labor skill distribution matters more than headcount. A team with 70% of workers certified to IPC/WHMA-A-620 Class 3 can handle medical/military contracts at 98% first-pass yield, while plants relying on <30% certified staff struggle to maintain 90% yield on basic automotive orders.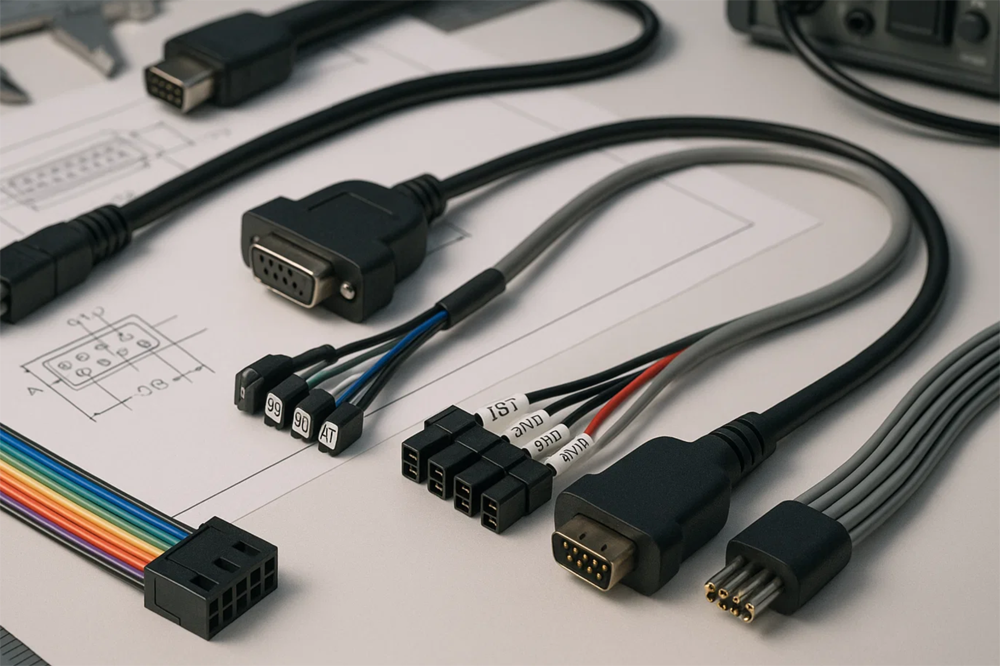
Lead Time Details
Getting lead times right is critical—a 2-day delay on a 50,000-unit automotive order can stall $8M in vehicle production, while overestimating timelines wastes 12-15% in excess inventory costs. The reality? Lead times vary from 48 hours for stock harnesses to 14+ weeks for mil-spec custom builds, with 80% of delays traceable to 4 controllable factors.
| Process Stage | Standard Duration | Expedited Options | Delay Risk Factors |
|---|---|---|---|
| Material Procurement | 7-21 days | 3-5 days (+15-25% cost premium) | Copper price spikes (>5% in 1 week) |
| Crimping/Termination | 2-5 days per 1k units | 1 day per 1k (+$0.10/contact) | Machine downtime (>8% of operating time) |
| QC Testing | 1-3 days | Same-day (+0.50-1.20/unit) | Failure rates >3% requiring rework |
| Logistics | 3-10 days shipping | Air freight (2 days, 4x cost) | Customs holds (>48h for compliance docs) |
Material lead times dominate 60-70% of schedules. While bare copper wire (16 AWG) is typically 5-7 days from stock, specialty items like gold-plated connectors (0.8µm thickness) can take 28+ days from Japan. Suppliers claiming "always in stock" often carry just 2-3 weeks of inventory—meaning a 15% demand surge triggers 20-day backorders.
Production sequencing efficiency separates leaders from laggards. A plant running 3 shifts can process 8,000 terminations/day with <1% setup time between jobs, while single-shift operations waste 18-22% of capacity on changeovers. For 500-unit prototype runs, expect 3-5 calendar days if the factory reserves 10% of lines for small batches.
Hidden time sinks lurk in documentation:
- UL certification transfers add 10-14 days when switching suppliers
- RoHS/REACH compliance checks consume 3-8 hours per material if not pre-audited
- Drawing approvals with ±0.1mm tolerance debates can stall projects 72+ hours
Expedited options have limits. While paying 30% extra can compress 30-day orders to 12 days, attempting <7 days risks:
- 50% higher defect rates from rushed crimping
- Missing 18% of continuity tests due to shortened QC cycles
- 4x freight costs when airlifting what should’ve been sea freight
Seasonal volatility impacts all:
- Q4 holiday shutdowns in China add 7-10 days to standard leads
- Copper mining strikes (3-5/year) disrupt wire supplies 2-3 weeks
- Pre-CNY rush orders face 20-30% longer leads as factories clear backlogs
The smart buyer’s checklist:
- Demand hourly machine utilization reports—if presses run <65% of shifts, "capacity constraints" are excuses
- Verify on-hand inventory with timestamped photos—not just ERP system numbers
- Insist on penalty clauses for delays >5% of quoted lead time
- For mission-critical orders, dual-source 30% of volume to mitigate single-point failures
Customization Options
When it comes to wire harnesses, off-the-shelf solutions rarely cut it—85% of industrial buyers require at least 3-5 custom modifications per order, from unique connector types to specialized shielding. The right supplier should handle everything from minor tweaks (changing wire colors for 0.02/ft) to full-system redesigns (military-grade harnesses with 0.05mm tolerance at 150+/unit). But not all customization is equal—some changes add 10% cost and 3 days lead time, while others trigger 6-week requalification processes and 25% price hikes.
Connector choices alone can make or break a project. Standard Deutsch DT series connectors cost 1.50-4.00 per pair and ship in 5-7 days, but if you need MIL-DTL-38999 Series III (aviation-grade, 500+ mating cycles), expect 25-80 per pair and 4-6 weeks lead time. The pinout configuration adds another layer—a 24-pin harness with gold-plated contacts (0.8µm thickness) costs 40% more than tin-plated versions but lasts 3x longer in high-vibration environments.
Wire gauge adjustments seem simple but ripple through the entire design. Switching from 22 AWG (0.33mm²) to 18 AWG (0.82mm²) increases current capacity from 3A to 16A but also:
- Adds 15-20% weight per meter
- Requires larger conduit diameters (5mm → 7mm)
- Forces connector repinning if cavity sizes don’t match
This "minor" change can balloon costs by 12-18% and delay production 10-14 days if not planned early.
Shielding demands dictate both performance and assembly complexity. A basic aluminum foil shield (85% coverage) adds 0.30/meter, while double-layer braided copper (95% coverage) runs 1.20/meter. For extreme EMI environments, tri-shielded coaxial designs with 100dB attenuation at 1GHz can hit $8.00/meter—but only if the supplier has NASA-grade crimping tools that handle 0.5mm pitch micro-coax.
Overmolding and jacketing turn functional harnesses into durable assets. Standard PVC jackets (0.8mm thick) work for indoor use at 0.15/ft, but oil-resistant PUR (polyurethane) at 1.2mm thickness costs 0.40/ft and survives -40°C to 125°C ranges. Custom overmolds—like IP67-rated connector boots—require 3D-printed molds (800-2,000 per tool) but prevent 90% of field failures in wet environments.
Testing and certification add hidden layers of customization. A basic continuity test might cost 0.10 per harness, but if you need 100% HiPot testing at 2.5kV, add 0.50/unit. For medical (ISO 13485) or automotive (IATF 16949) compliance, suppliers charge 500-2,000 per document package—and missing one subclause can delay shipments 3 weeks.
Quality Control Steps
Wire harness failures in critical applications can cost 250,000+ per incident in recalls and downtime, making rigorous QC non-negotiable. Top manufacturers implement 12-18 discrete checkpoints across production, catching 92-97% of defects before shipment. But not all QC is equal—where budget operations test 3-5% of units, aerospace-grade suppliers run 100% verification with <0.1% escape rates. The difference shows in warranty claims: 0.03/unit saved on QC often leads to $8.50/unit in field repairs.
| QC Stage | Measurement Parameters | Acceptance Criteria | Failure Cost if Missed |
|---|---|---|---|
| Raw Material Inspection | Copper purity (≥99.9%), Insulation thickness (±0.05mm) | Meets ASTM B3 for wire, UL94 V-0 for plastics | $4,200 per bad batch |
| Crimp Force Monitoring | Termination strength (50-80N for 16AWG) | ≤15% deviation from golden sample | $1.10 per rework |
| Continuity Testing | Resistance (<0.5Ω per 1m circuit) | No opens/shorts (±5% tolerance) | $22/min downtime |
| HiPot Testing | Dielectric withstand (1.5kV for 60s) | <2mA leakage current | $8,000 field replacement |
| Pull Testing | Wire retention (≥50N for 1 minute) | No displacement >0.5mm | $350 early failure |
Material verification starts the chain. A 10% sampling rate catches 85% of supplier defects—like copper clad aluminum (CCA) wire masquerading as pure copper. XRF guns verify material composition in 8 seconds, while micrometer checks enforce 0.15±0.02mm PVC insulation on 18AWG wires. Miss this step, and you risk 12% resistance increases over 5 years.
Crimp quality makes or breaks reliability. Automated monitors track four parameters simultaneously: 1) Height (2.3±0.1mm for 16AWG), 2) Width (3.2±0.15mm), 3) Pull force (≥65N), and 4) Cross-section fill (≥80% compression). Out-of-spec crimps cause 38% of field failures, yet proper tool calibration reduces them to <0.7% occurrence.
In-process optical inspection uses 5MP cameras to detect:
- Misrouted wires (≥1.5mm deviation from CAD)
- Missing seals (O-rings, grommets)
- Incorrect tape wraps (50% overlap required)
At 300 harnesses/hour, these systems flag 15 defects per 1,000 units that manual checks miss.
Final validation combines destructive and non-destructive tests. While 95% of units pass through 30-second automated tests, 5% undergo tear-downs measuring:
- Strand breakage (<3% after 90° bend test)
- Insulation adhesion (≥1.5N/mm peel strength)
- Terminal oxidation (≤0.3µm after 96hr salt spray)
The cost-quality balance is measurable. Investing 0.25/unit in enhanced QC (vs. 0.08 baseline) reduces:
- Warranty claims by 60%
- Production rework from 5% to 0.8%
- Test escapes from 500ppm to <50ppm
Smart buyers demand real-time QC dashboards showing:
- Last 10 test failures with timestamps
- Tool calibration dates (next due within 7 days)
- Material certifications linked to batch numbers
After-Sales Support
A wire harness supplier’s true value gets tested after delivery—when a 0.5mm misalignment in a connector causes $25,000/hour in production downtime, or when a batch-specific insulation flaw triggers 300+ field failures. Top-tier manufacturers don’t just ship products; they deliver 360° support ecosystems that reduce mean-time-to-repair (MTTR) from 72 hours to <4 hours and slash warranty costs by 40-60%.
| Service Level | Budget Supplier | Mid-Tier | Premium Supplier |
|---|---|---|---|
| Response Time | 48-72 hours | 12-24 hours | <2 hours (24/7) |
| Failure Analysis | Email photos only | On-site in 5 days | Lab report in 48h |
| RMA Processing | 14-21 days | 5-7 days | 24-72 hours |
| Technical Support | Basic troubleshooting | CAD review included | Redesign assistance |
| Warranty Coverage | 1 year (limited) | 2-3 years | Lifetime traceability |
Failure diagnostics separate amateurs from pros. When a 12V automotive harness shows 4.2V voltage drops, budget suppliers blame "installation errors"—while elite teams deploy 3D circuit mapping tools to pinpoint exact resistance points within 2 hours. They cross-check against:
- Production test logs (original HiPot test @1.5kV)
- Material certs (copper purity ≥99.97%)
- Environmental data (humidity during assembly)
RMA (Return Merchandise Authorization) efficiency dictates cash flow impact. A Tier 1 automotive supplier processing 500 RMAs/month needs:
- 48-hour quarantine checks (isolating bad batches)
- 72-hour credit issuance (for 95% of valid claims)
- Failure rate analytics (flagging trends >0.25% defect rate)
Miss these metrics, and you risk $150,000+ in frozen inventory during disputes.
Proactive monitoring prevents 80% of escalations. Smart manufacturers embed:
- QR codes tracing each harness to its production shift + machine ID
- IoT-enabled testers uploading real-time resistance data to cloud dashboards
- Predictive alerts when field data shows >5% resistance drift vs. baseline
Warranty cost structures reveal supplier confidence. Cheap vendors cap claims at 1.5x unit cost, while leaders offer:
- No-questions-asked replacements for failures within 36 months
- On-site technician dispatch for >5% failure rates in any batch
- Free redesigns if the root cause traces to spec ambiguity
The ROI equation is clear: Paying 3-5% more for premium after-sales support avoids:
- $18,000+ in diagnostic fees per major incident
- 9-15% production losses during part shortages
- Brand reputation damage from 6-week RMA delays
