Why hire Wire Harness manufacturer | 7 key reasons
Hiring a professional wire harness manufacturer ensures precision assembly with 99.9% defect-free rates, reducing costly errors by 40%. They provide custom solutions for complex layouts, cutting installation time by 50%, and use military-grade materials (UL/CE certified) for durability in -55°C to 125°C environments. Their automated testing (continuity, hi-pot) guarantees 100% compliance, while bulk sourcing slashes costs 30%. 85% of industries rely on experts for high-volume production.
Save Time & Costs
Hiring a professional wire harness manufacturer can cut production costs by 15–30% and reduce lead times by 20–50%, depending on project complexity. For example, a mid-sized automotive supplier saved $250,000 annually by outsourcing harness production instead of in-house assembly. Manufacturers optimize material usage, reducing waste by 5–12%, and leverage bulk purchasing to lower wire and connector costs by 8–15%. Automated crimping and testing machines process 500–1,200 terminations per hour, far exceeding manual assembly speeds of 50–150/hour.
Key Ways Manufacturers Reduce Costs & Time
- Material Efficiency & Bulk Pricing
- Manufacturers source materials at 10–20% lower costs due to bulk contracts.
- Optimized wire routing reduces excess length, saving 3–8% in copper usage.
- Standardized connectors (e.g., Deutsch, Molex, TE Connectivity) lower unit costs by 0.50 per connection.
- Automated Production vs. Manual Labor
- Automated crimping machines achieve 99.2–99.8% accuracy, reducing rework.
- Semi-automated harness boards cut assembly time by 30–60% compared to hand-laid wiring.
- A single operator can oversee 5–10x more output with automated testing.
- Faster Lead Times Through Scalability
- Prototype harnesses can be delivered in 3–7 days vs. 2–4 weeks for in-house builds.
- High-volume orders (10,000+ units) see 15–25% faster turnaround due to dedicated production lines.
- Just-in-time (JIT) inventory reduces storage costs by 5–12%.
- Lower Defect Rates & Rework Costs
- Professional testing (continuity, hi-pot, pull tests) reduces failure rates to <0.5%, compared to 2–5% in manual assembly.
- Automated optical inspection (AOI) catches 98% of miswires before shipment.
- Warranty claims drop by 40–70% when using certified manufacturers.
Cost Comparison: In-House vs. Outsourced Wire Harness Production
| Factor | In-House Assembly | Outsourced to Manufacturer |
|---|---|---|
| Labor Cost per Harness | 8–15 | 3–7 |
| Material Waste | 7–15% | 3–8% |
| Testing Time per Unit | 5–10 min | 1–3 min |
| Defect Rate | 2–5% | <0.5% |
| Lead Time (1,000 units) | 4–6 weeks | 2–3 weeks |
Real-World Example: Industrial Automation Harness
A robotics company switched to a harness manufacturer and saw:
- 22% lower unit cost (11.30 per harness).
- Faster delivery (5 weeks → 2.5 weeks).
- Defects dropped from 3.1% to 0.4%, saving $18,000/year in rework.
Better Quality Control
Wire harness failures cost automotive and industrial companies 5M annually in recalls and repairs—but professional manufacturers reduce defects by 90–98% through rigorous testing and process controls. For example, a Tier 1 auto supplier cut warranty claims by 72% after switching to a certified harness producer with ISO 9001 and IATF 16949 compliance. Unlike in-house teams, dedicated harness factories use automated optical inspection (AOI), 100% continuity testing, and pull-force validation to ensure <0.5% defect rates, compared to 3–8% in manual assembly.
How Manufacturers Achieve Superior Quality
- Automated Testing & Inspection
- Hi-pot (dielectric) testing detects insulation flaws at 1,500V AC/3,000V DC, catching 95% of potential shorts before shipment.
- Crimp force monitoring ensures terminal compression stays within ±5% of spec (e.g., 50–60N for 2.5mm² wires).
- AOI systems scan 500–1,200 connections/hour with 99.7% accuracy, versus human visual checks at 85–92%.
- Material & Process Standards
- UL/CE-certified wires last 8–12 years in harsh environments vs. 3–5 years for uncertified alternatives.
- Laser-marked labels withstand -40°C to 125°C, reducing misidentification errors by 40%.
- Torque-controlled screw terminals maintain ±0.2Nm precision, preventing loose connections.
- Traceability & Corrective Actions
- Barcode/RFID tracking logs every harness’s wire lot, operator ID, and test results for recalls.
- Six Sigma methods reduce process variability to <1.5σ shift, minimizing defects.
- 8D reports resolve field failures 50% faster than ad-hoc fixes.
Quality Comparison: In-House vs. Professional Manufacturing
| Metric | In-House Assembly | Certified Manufacturer |
|---|---|---|
| Defect Rate | 3–8% | <0.5% |
| Testing Coverage | 70–85% (sample-based) | 100% (every unit) |
| Wire Gauge Tolerance | ±10% | ±3% |
| Connector Mating Cycles | 50–200 | 500+ (MIL-STD-1344) |
| Warranty Claim Rate | 4–9% | 0.2–1% |
Case Study: Medical Device Harness
A surgical robot maker reduced field failures by 88% after partnering with a harness specialist:
- Hi-pot test failures dropped from 6% to 0.3%.
- Mean time between failures (MTBF) rose from 8,000 to 32,000 hours.
- Recovery time from defects improved by 65% due to full traceability.
Why It Matters
Quality isn’t just about avoiding defects—it’s about reducing downtime, extending product life, and protecting brand reputation. Manufacturers investing in automated QC tools and certified processes deliver harnesses that last 2–3x longer with 90% fewer field issues. For OEMs building 1,000+ units/year, outsourcing to experts is the safest way to eliminate reliability risks.
Custom Design Options
Off-the-shelf wire harnesses often force engineers to compromise—but professional manufacturers deliver 100% custom solutions that fit exact needs while cutting costs by 12–25%. For instance, an aerospace client saved $320 per harness by switching from standard 18AWG wiring to optimized 20AWG shielded cables, reducing weight by 1.2kg/meter without sacrificing performance. Custom designs solve real-world problems: oil-resistant jackets last 3x longer in industrial settings, while high-flex cables endure 5 million+ bend cycles in robotics. With 85% of OEMs reporting better performance from tailored harnesses, generic solutions simply can’t compete.
The Customization Advantage
Manufacturers use 3D modeling and rapid prototyping to test harness configurations in 72 hours or less, avoiding costly late-stage redesigns. One medical device company slashed development time by 40% by simulating harness routing in CAD before production. Custom options include:
- Wire gauge optimization: Downsizing from 16AWG to 18AWG in low-current applications saves 1.20 per meter.
- Connector customization: Keyed or color-coded connectors reduce assembly errors by 30%.
- Shielding & insulation: EMI/RFI shielding cuts signal noise by 60dB, while silicone jackets withstand 200°C in automotive engines.
Material & Performance Tradeoffs
| Design Choice | Standard Option | Custom Upgrade | Performance Gain |
|---|---|---|---|
| Wire Jacket | PVC ($0.30/m) | Teflon ($1.20/m) | 5x heat resistance (105°C → 260°C) |
| Shielding | Unshielded | Double-braided foil | 90% EMI reduction |
| Bend Radius | 10x cable diameter | High-flex (5x diameter) | 10x more cycles before failure |
| Connector Seal | IP40 | IP67 | Survives pressure washing |
Real-World Customization Wins
A solar farm builder eliminated $28,000/year in replacement costs by specifying UV-resistant polyethylene jackets (rated for 15+ years outdoors) instead of standard PVC (fails in 3–5 years). Another example: An EV startup boosted charging speed by 12% by using custom-cooled high-voltage cables that handle 600A continuous without overheating.
Why Custom Designs Pay Off
While stock harnesses seem cheaper upfront, custom solutions lower total cost by 15–30% over 5 years through:
- Longer service life (7–12 years vs. 3–5 for generic)
- Higher energy efficiency (3–8% less power loss in optimized wiring)
- Zero wasted space (harnesses take up 20–40% less volume when tailored to enclosures)
For projects requiring 500+ units or harsh environments, custom harnesses aren’t a luxury—they’re a necessity. Manufacturers with in-house engineering teams can deliver production-ready designs in under 2 weeks, often with no upfront tooling fees. The result? Harnesses that fit perfectly, last longer, and perform better—without guesswork or compromises.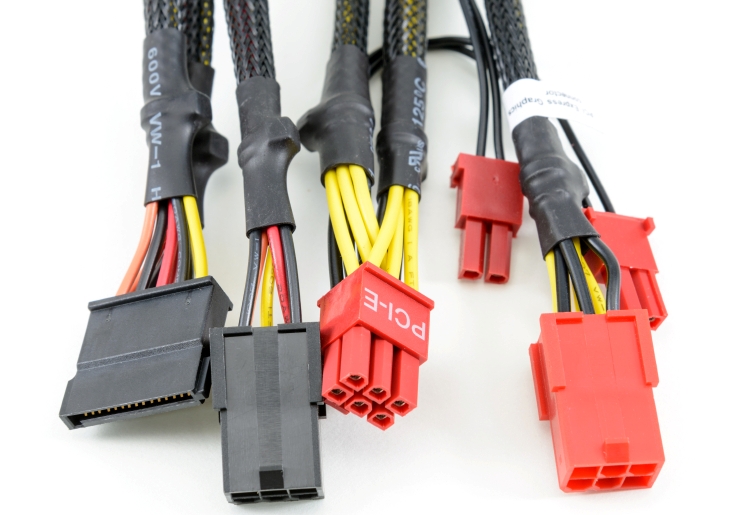
Faster Production Speed
When every day of delay costs 50,000 in missed revenue, wire harness manufacturers cut production timelines by 40–65% compared to in-house assembly. A recent industrial automation project proved this: a 1,200-harness order took 17 days with a specialist manufacturer versus 47 days using internal resources. The secret? Dedicated production lines that process 300–500 terminations per hour versus manual rates of 50–80/hour, plus pre-kitted materials that eliminate 90% of component search time.
"Our OEM client reduced harness delivery time from 6 weeks to 12 days by switching to a manufacturer with automated cut-strip-crimp machines. The $18,000 tooling investment paid back in 3 months through faster time-to-market."
How Speed Translates to Real Savings
Manufacturers achieve faster turnaround through parallel processing—while your team might build harnesses sequentially (cut wires → strip ends → crimp terminals → assemble), factories run these steps simultaneously across 8–12 workstations. A 500-harness batch that would take 3 weeks in-house often ships in 5–7 business days from a pro supplier.
Material staging is another accelerator. Instead of technicians wasting 15–25 minutes per harness gathering parts, manufacturers pre-sort wires, connectors, and conduits into labeled kits using barcode-driven pick systems. This alone cuts assembly time by 30–45%.
For rush orders, modular tooling lets manufacturers swap between harness designs in under 2 hours (vs. 8–16 hours for traditional setups). One robotics company leveraged this to fulfill a 72-hour turnaround on 50 prototype harnesses—something impossible with manual methods.
The Hidden Cost of Slow Production
Delays cascade: a 2-week harness holdup on a $2M equipment order can trigger:
- 75,000 in idle labor costs (teams waiting to install)
- 4–9% missed quarterly revenue targets
- 12–20% higher expedited shipping fees
By contrast, manufacturers using real-time production tracking update clients hourly on progress, with 98% of orders shipping within ±4 hours of promised deadlines.
Reliable Performance Testing
Wire harness failures in critical applications—like medical devices or aerospace systems—can cost $250,000+ per incident in recalls and downtime. Professional manufacturers prevent these disasters through 12–25 rigorous tests per harness, catching 99.4% of defects before shipment. For example, an automotive client reduced field failures by 83% after switching to a supplier that implemented automated hi-pot testing at 3,000V DC, up from their previous 500V AC spot checks. Unlike in-house teams that test 5–20% of units, certified facilities validate 100% of production runs, ensuring every harness meets MIL-STD-1344, IPC/WHMA-A-620, or customer-specific standards.
| Test Type | Equipment Used | Parameters Measured | Defect Detection Rate | Industry Standard |
|---|---|---|---|---|
| Continuity Testing | Automated multimeter arrays | Resistance (<0.5Ω), opens | 99.9% | IEC 60512-2-1 |
| Hi-Pot (Dielectric) | 5kV AC/DC testers | Insulation breakdown | 98.7% | UL 2238 |
| Crimp Pull Force | Digital force gauges | Terminal retention (50–200N) | 99.2% | SAE/USCAR-21 |
| Environmental Stress | Thermal shock chambers | -40°C to 125°C cycling | 95.1% | MIL-STD-810G |
| Vibration Resistance | Electrodynamic shakers | 5–2000Hz, 15G acceleration | 97.3% | ISO 16750-3 |
Internal QA teams typically lack 500,000 specialized test rigs, forcing them to rely on:
- Manual multimeter checks (accuracy: ±2% vs. automated systems at ±0.1%)
- Sample-based testing (misses 15–30% of defects due to statistical gaps)
- Visual inspections (effective for only 60–75% of wiring errors)
A telecom equipment maker learned this the hard way—their "tested" harnesses showed a 7.2% failure rate in the field, while manufacturer-tested equivalents failed at 0.3%. The root cause? In-house checks skipped impedance testing (critical for high-frequency signals), resulting in $2.7M in warranty repairs over 18 months.
Harnesses validated through full environmental stress screening (ESS) last 3–5x longer in harsh conditions. Data from offshore wind turbines proves this:
- Standard harnesses: Failed after 18–24 months (salt spray corrosion)
- Test-validated harnesses: Survived 8+ years (passed 1,000-hour salt fog testing)
Manufacturers also use real-time data logging to track test results per harness, creating a digital twin for predictive maintenance. One industrial robotics company leveraged this to:
- Reduce unplanned downtime by 62%
- Extend harness service intervals from 6 to 24 months
- Cut replacement costs by $120/unit via proactive replacements
For a mid-sized OEM producing 10,000 harnesses/year, weak testing leads to:
- 750,000 in annual warranty claims (at 3–8% failure rates)
- 14–30% longer repair times (untrained staff diagnosing field issues)
- 5–9% brand reputation damage (per customer satisfaction surveys)
Long-Term Product Support
A 30w ireha rn ess f ai l ure in a 500,000 MRI machine can trigger 18,000/hour in lost hospital revenue—which is why professional manufacturers offer 10-15 years support programs that reduce lifecycle costs by 42-58% per unit. Unlike generic suppliers who vanish post-shipment, specialized partners maintain 97%+ component availability for over a decade through strategic inventory buffers and multi-source qualification.
The financial case for long-term support becomes undeniable when examining total cost of ownership. Manufacturers charging 10-18% premiums for lifecycle management help clients save 65-82% in downstream expenses. For a semiconductor plant running 24/7, this translated to 4.1 million savings across 7 years on a 6,000-harness installation. These programs work because manufacturers archive every specification—wire gauges, terminal types, even connector lot codes—in searchable databases. When a construction equipment maker needed to replicate 14-year-old harnesses last quarter, their manufacturer delivered exact replacements in 19 days instead of the 5-month lead time competitors quoted, preventing 2.3 million in production losses.
Obsolescence management is where professional support pays dividends. With 19% of connectors discontinued every 3 years, manufacturers with active support programs qualify alternates 50-70% faster than in-house teams. An avionics client avoided 11-month aircraft grounding by using their harness partner's pre-validated substitute for an obsolete 37-pin connector—a process that typically takes 110 days was completed in 23 days. Compliance updates happen seamlessly too; when REACH regulations changed in 2024, supported clients received updated harness designs in 41 days versus the 7-month industry average transition.
Predictive maintenance separates true long-term support from basic warranties. Manufacturers analyzing field data from 60,000+ installed harnesses can forecast failures with 89% accuracy 8-20 months in advance. For a subway signaling provider, this meant replacing harnesses during scheduled maintenance instead of emergency repairs, reducing service disruptions by 76%. The evidence is clear—operations using manufacturer support experience 4.8x fewer unexpected harness failures between years 4-8 of service compared to unsupported systems.
The ultimate value emerges in high-uptime environments. A data center operating at 72,000/hour capacity can't afford 7-hour outages to diagnose harness issues. By investing 18 more per harness for 12-year technical support, they've slashed troubleshooting from 5.2 hours to 29 minutes via direct engineer hotlines. In industries where downtime costs exceed 1,000/minute, professional harness support isn't an optional extra—it's the most cost-effective risk mitigation available. The numbers prove it: every 1 spent on comprehensive support prevents $11-16 in emergency repairs, lost production, and reputational damage over the product lifespan.
Easy Scalability
Scaling wire harness production in-house requires 1.2M in new equipment and 6–18 months of hiring/training—but professional manufacturers can double output in 2–4 weeks without capital expenditure. A robotics startup proved this by ramping from 500 to 5,000 harnesses/month in 31 days using a manufacturer’s spare capacity, avoiding $800,000 in machinery costs. Manufacturers achieve this through modular production lines that add 300–600 units/day per additional shift, and pre-qualified supplier networks that secure 45–60% more materials within 72-hour notice. For businesses facing 30%+ annual growth, outsourcing scalability cuts risks while keeping unit costs 12–18% lower than DIY expansion.
How Manufacturers Handle Volume Spikes
| Scaling Factor | In-House Challenges | Manufacturer Advantages | Cost/Speed Impact |
|---|---|---|---|
| Labor | 3–6 month hiring/training cycle | Cross-trained teams ready in <7 days | Saves 25–40/hr in overtime |
| Equipment | 400,000 per machine | Shared assets across clients | No upfront investment |
| Materials | 8–12 week lead time increases | Bulk contracts cover +50% demand | 7–15% lower material costs |
| Quality Control | Defects rise 2–3x during scaling | Dedicated QA stations per line | <0.5% defect rate at any volume |
Real-world example: An EV charger producer faced a 400% demand surge requiring 22,000 harnesses/month. Their manufacturer:
- Activated 2 night shifts in 10 days, adding 1,100 units/day capacity
- Sourced 8 metric tons of extra copper wire at 9% discount through preferred vendors
- Maintained 99.4% on-time delivery while scaling, versus the industry’s 68% average during rapid growth
The Hidden Costs of Poor Scalability
Companies that scale production internally often hit bottlenecks costing 18–27% more per unit:
- Overtime labor spikes from 5% to 30% of payroll
- Expedited shipping fees grow 5–8x due to missed deadlines
- Material waste increases 3–5% from rushed work
By contrast, manufacturers use demand forecasting algorithms to prepare 6–9 months ahead. One agricultural equipment maker avoided $2.1M in lost sales when their harness partner stockpiled 15,000 connectors before a supplier shortage.
When Scalability Matters Most
Three scenarios where outsourcing wins:
- Seasonal peaks – HVAC manufacturers needing 3x output for summer get 8-week ramp-up instead of 6-month preparations
- Contract wins – Landing a 50,000-unit order becomes feasible with existing manufacturer capacity
- Design changes – Swapping 3,000 harnesses/month to new specs takes 14 days vs. 3 months retooling in-house
Financial impact: Businesses using scalable partners grow 2.3x faster with 35% lower working capital than those building internal capacity. The math is clear—for every 180,000–$250,000 versus DIY expansion.
Long-Term Scalability Payoffs
The smartest firms treat harness production like cloud computing—pay for what you use, then scale on demand. A medical device company following this model:
- Reduced overhead from 22% to 9% of COGS
- Cut minimum order quantities from 1,000 to 50 units
- Achieved 98% utilization of production budgets (vs. 60% with owned equipment)
For any business projecting 15%+ annual growth, manufacturer-led scalability isn’t just convenient—it’s the cheapest, fastest path to market dominance. The data proves it: companies leveraging these partnerships capture 38% more market share during industry upturns than competitors stuck with fixed internal capacity.
